Cuban vs Immigrants from India 7th Grade
COMPARE
Cuban
Immigrants from India
7th Grade
7th Grade Comparison
Cubans
Immigrants from India
94.6%
7TH GRADE
0.0/ 100
METRIC RATING
296th/ 347
METRIC RANK
96.9%
7TH GRADE
99.6/ 100
METRIC RATING
68th/ 347
METRIC RANK
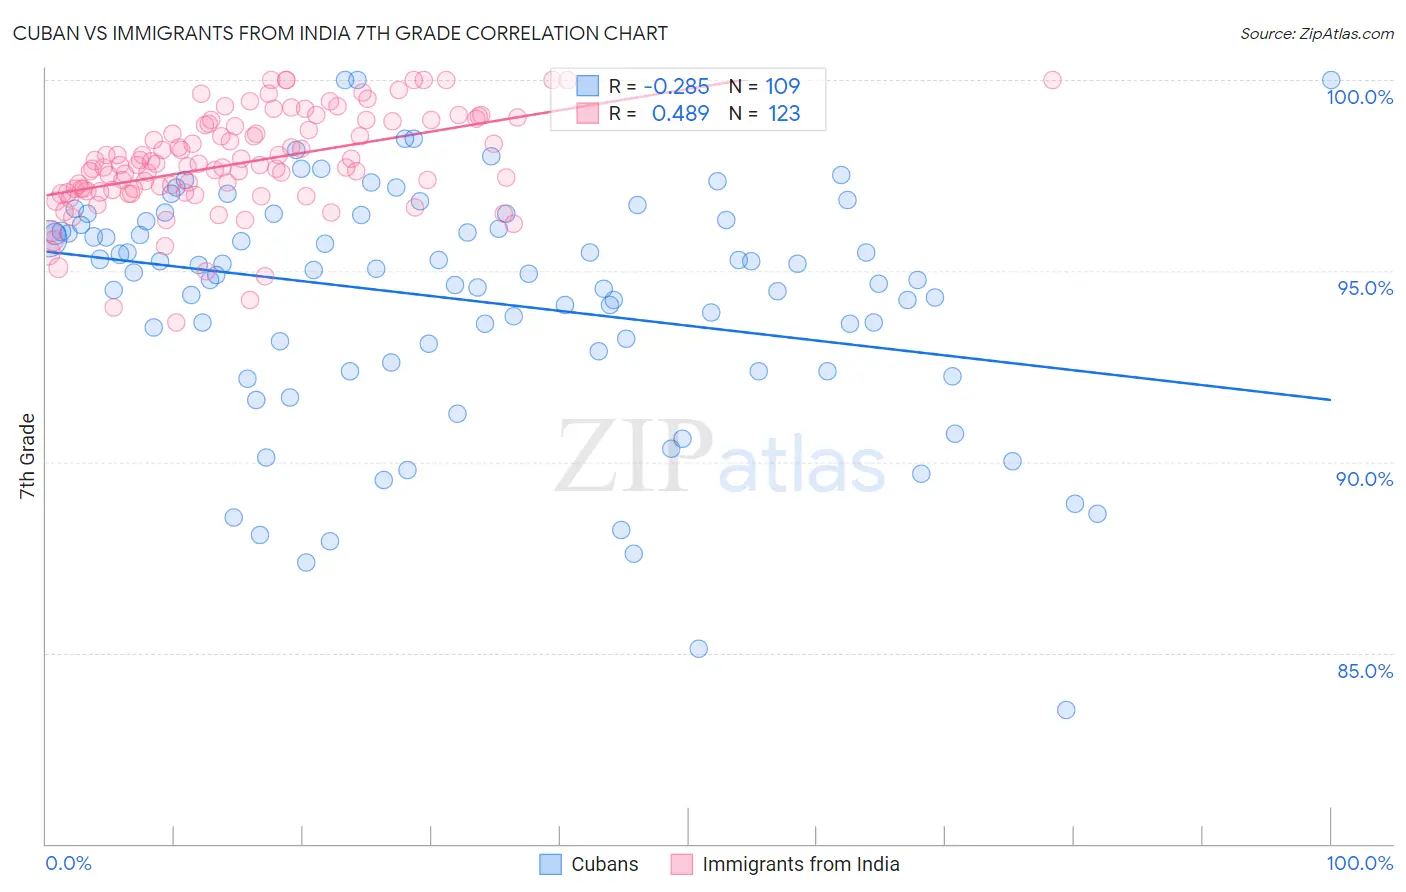
Cuban vs Immigrants from India 7th Grade Correlation Chart
The statistical analysis conducted on geographies consisting of 449,368,946 people shows a weak negative correlation between the proportion of Cubans and percentage of population with at least 7th grade education in the United States with a correlation coefficient (R) of -0.285 and weighted average of 94.6%. Similarly, the statistical analysis conducted on geographies consisting of 434,105,844 people shows a moderate positive correlation between the proportion of Immigrants from India and percentage of population with at least 7th grade education in the United States with a correlation coefficient (R) of 0.489 and weighted average of 96.9%, a difference of 2.4%.
7th Grade Correlation Summary
| Measurement | Cuban | Immigrants from India |
| Minimum | 83.5% | 93.7% |
| Maximum | 100.0% | 100.0% |
| Range | 16.5% | 6.3% |
| Mean | 94.2% | 97.8% |
| Median | 94.9% | 97.8% |
| Interquartile 25% (IQ1) | 92.7% | 97.1% |
| Interquartile 75% (IQ3) | 96.3% | 98.9% |
| Interquartile Range (IQR) | 3.6% | 1.9% |
| Standard Deviation (Sample) | 3.1% | 1.3% |
| Standard Deviation (Population) | 3.1% | 1.3% |
Similar Demographics by 7th Grade
Demographics Similar to Cubans by 7th Grade
In terms of 7th grade, the demographic groups most similar to Cubans are Yaqui (94.6%, a difference of 0.010%), Haitian (94.7%, a difference of 0.040%), Immigrants from South Eastern Asia (94.5%, a difference of 0.10%), Indonesian (94.5%, a difference of 0.11%), and Bangladeshi (94.5%, a difference of 0.11%).
| Demographics | Rating | Rank | 7th Grade |
| Taiwanese | 0.0 /100 | #289 | Tragic 94.8% |
| Malaysians | 0.0 /100 | #290 | Tragic 94.8% |
| Immigrants | Grenada | 0.0 /100 | #291 | Tragic 94.8% |
| Immigrants | West Indies | 0.0 /100 | #292 | Tragic 94.8% |
| Fijians | 0.0 /100 | #293 | Tragic 94.7% |
| Haitians | 0.0 /100 | #294 | Tragic 94.7% |
| Yaqui | 0.0 /100 | #295 | Tragic 94.6% |
| Cubans | 0.0 /100 | #296 | Tragic 94.6% |
| Immigrants | South Eastern Asia | 0.0 /100 | #297 | Tragic 94.5% |
| Indonesians | 0.0 /100 | #298 | Tragic 94.5% |
| Bangladeshis | 0.0 /100 | #299 | Tragic 94.5% |
| Immigrants | Burma/Myanmar | 0.0 /100 | #300 | Tragic 94.5% |
| Immigrants | Dominica | 0.0 /100 | #301 | Tragic 94.5% |
| Immigrants | Laos | 0.0 /100 | #302 | Tragic 94.5% |
| Sri Lankans | 0.0 /100 | #303 | Tragic 94.4% |
Demographics Similar to Immigrants from India by 7th Grade
In terms of 7th grade, the demographic groups most similar to Immigrants from India are Ukrainian (96.9%, a difference of 0.020%), Native Hawaiian (96.9%, a difference of 0.020%), Iranian (96.8%, a difference of 0.020%), New Zealander (96.8%, a difference of 0.030%), and Immigrants from Lithuania (96.8%, a difference of 0.030%).
| Demographics | Rating | Rank | 7th Grade |
| Creek | 99.8 /100 | #61 | Exceptional 96.9% |
| Immigrants | North America | 99.8 /100 | #62 | Exceptional 96.9% |
| Immigrants | Northern Europe | 99.7 /100 | #63 | Exceptional 96.9% |
| Immigrants | Austria | 99.7 /100 | #64 | Exceptional 96.9% |
| Canadians | 99.7 /100 | #65 | Exceptional 96.9% |
| Ukrainians | 99.7 /100 | #66 | Exceptional 96.9% |
| Native Hawaiians | 99.7 /100 | #67 | Exceptional 96.9% |
| Immigrants | India | 99.6 /100 | #68 | Exceptional 96.9% |
| Iranians | 99.6 /100 | #69 | Exceptional 96.8% |
| New Zealanders | 99.6 /100 | #70 | Exceptional 96.8% |
| Immigrants | Lithuania | 99.6 /100 | #71 | Exceptional 96.8% |
| Cajuns | 99.5 /100 | #72 | Exceptional 96.8% |
| Arapaho | 99.5 /100 | #73 | Exceptional 96.8% |
| Immigrants | England | 99.5 /100 | #74 | Exceptional 96.8% |
| Zimbabweans | 99.5 /100 | #75 | Exceptional 96.8% |