Crow vs Immigrants from Hungary Median Earnings
COMPARE
Crow
Immigrants from Hungary
Median Earnings
Median Earnings Comparison
Crow
Immigrants from Hungary
$38,707
MEDIAN EARNINGS
0.0/ 100
METRIC RATING
336th/ 347
METRIC RANK
$50,227
MEDIAN EARNINGS
99.5/ 100
METRIC RATING
84th/ 347
METRIC RANK
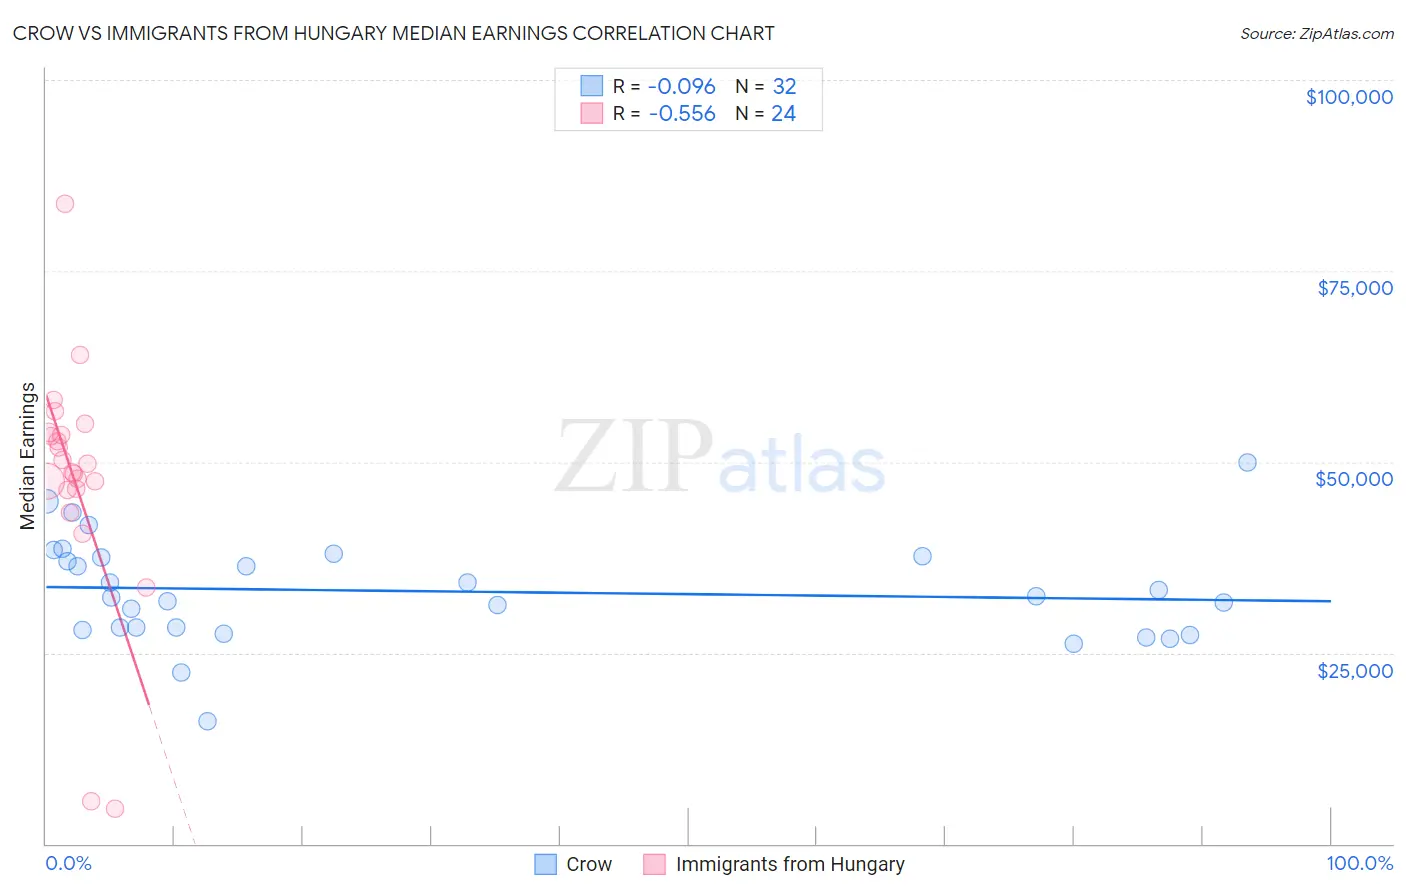
Crow vs Immigrants from Hungary Median Earnings Correlation Chart
The statistical analysis conducted on geographies consisting of 59,204,148 people shows a slight negative correlation between the proportion of Crow and median earnings in the United States with a correlation coefficient (R) of -0.096 and weighted average of $38,707. Similarly, the statistical analysis conducted on geographies consisting of 195,705,454 people shows a substantial negative correlation between the proportion of Immigrants from Hungary and median earnings in the United States with a correlation coefficient (R) of -0.556 and weighted average of $50,227, a difference of 29.8%.
Median Earnings Correlation Summary
| Measurement | Crow | Immigrants from Hungary |
| Minimum | $16,094 | $4,622 |
| Maximum | $49,926 | $83,751 |
| Range | $33,832 | $79,129 |
| Mean | $33,045 | $47,628 |
| Median | $32,361 | $49,169 |
| Interquartile 25% (IQ1) | $28,093 | $46,381 |
| Interquartile 75% (IQ3) | $37,549 | $53,646 |
| Interquartile Range (IQR) | $9,456 | $7,266 |
| Standard Deviation (Sample) | $6,875 | $15,967 |
| Standard Deviation (Population) | $6,767 | $15,631 |
Similar Demographics by Median Earnings
Demographics Similar to Crow by Median Earnings
In terms of median earnings, the demographic groups most similar to Crow are Native/Alaskan ($38,896, a difference of 0.49%), Spanish American Indian ($38,907, a difference of 0.52%), Houma ($38,949, a difference of 0.62%), Immigrants from Cuba ($38,426, a difference of 0.73%), and Yakama ($39,107, a difference of 1.0%).
| Demographics | Rating | Rank | Median Earnings |
| Kiowa | 0.0 /100 | #329 | Tragic $39,232 |
| Immigrants | Congo | 0.0 /100 | #330 | Tragic $39,169 |
| Immigrants | Mexico | 0.0 /100 | #331 | Tragic $39,114 |
| Yakama | 0.0 /100 | #332 | Tragic $39,107 |
| Houma | 0.0 /100 | #333 | Tragic $38,949 |
| Spanish American Indians | 0.0 /100 | #334 | Tragic $38,907 |
| Natives/Alaskans | 0.0 /100 | #335 | Tragic $38,896 |
| Crow | 0.0 /100 | #336 | Tragic $38,707 |
| Immigrants | Cuba | 0.0 /100 | #337 | Tragic $38,426 |
| Pima | 0.0 /100 | #338 | Tragic $38,285 |
| Menominee | 0.0 /100 | #339 | Tragic $37,884 |
| Navajo | 0.0 /100 | #340 | Tragic $36,999 |
| Lumbee | 0.0 /100 | #341 | Tragic $36,876 |
| Hopi | 0.0 /100 | #342 | Tragic $36,871 |
| Pueblo | 0.0 /100 | #343 | Tragic $36,859 |
Demographics Similar to Immigrants from Hungary by Median Earnings
In terms of median earnings, the demographic groups most similar to Immigrants from Hungary are Immigrants from Kazakhstan ($50,225, a difference of 0.0%), Romanian ($50,244, a difference of 0.030%), Immigrants from Canada ($50,192, a difference of 0.070%), Immigrants from Moldova ($50,274, a difference of 0.090%), and Immigrants from Southern Europe ($50,280, a difference of 0.11%).
| Demographics | Rating | Rank | Median Earnings |
| Immigrants | Western Europe | 99.7 /100 | #77 | Exceptional $50,549 |
| Argentineans | 99.6 /100 | #78 | Exceptional $50,399 |
| Laotians | 99.6 /100 | #79 | Exceptional $50,343 |
| Ukrainians | 99.6 /100 | #80 | Exceptional $50,320 |
| Immigrants | Southern Europe | 99.6 /100 | #81 | Exceptional $50,280 |
| Immigrants | Moldova | 99.5 /100 | #82 | Exceptional $50,274 |
| Romanians | 99.5 /100 | #83 | Exceptional $50,244 |
| Immigrants | Hungary | 99.5 /100 | #84 | Exceptional $50,227 |
| Immigrants | Kazakhstan | 99.5 /100 | #85 | Exceptional $50,225 |
| Immigrants | Canada | 99.5 /100 | #86 | Exceptional $50,192 |
| Immigrants | Uzbekistan | 99.5 /100 | #87 | Exceptional $50,151 |
| Albanians | 99.4 /100 | #88 | Exceptional $50,116 |
| Immigrants | North America | 99.4 /100 | #89 | Exceptional $50,108 |
| Italians | 99.3 /100 | #90 | Exceptional $49,915 |
| Macedonians | 99.2 /100 | #91 | Exceptional $49,893 |