Croatian vs Immigrants from Thailand Unemployment Among Women with Children Under 6 years

COMPARE

Croatian
Race
Ancestry
AfghanAfricanAlaska NativeAlaskan AthabascanAlbanianAleutAlsatianAmericanApacheArabArapahoArgentineanArmenianAssyrian/Chaldean/SyriacAustralianAustrianBahamianBangladeshiBarbadianBasqueBelgianBelizeanBermudanBhutaneseBlackfeetBolivianBrazilianBritishBritish West IndianBulgarianBurmeseCajunCambodianCanadianCape VerdeanCarpatho RusynCelticCentral AmericanCentral American IndianCherokeeCheyenneChickasawChileanChineseChippewaChoctawColombianColvilleComancheCosta RicanCreeCreekCroatianCrowCubanCypriotCzechCzechoslovakianDanishDelawareDominicanDutchDutch West IndianEastern EuropeanEcuadorianEgyptianEnglishEstonianEthiopianEuropeanFijianFilipinoFinnishFrenchFrench American IndianFrench CanadianGermanGerman RussianGhanaianGreekGuamanian/ChamorroGuatemalanGuyaneseHaitianHmongHonduranHopiHoumaHungarianIcelanderIndian (Asian)IndonesianInupiatIranianIraqiIrishIroquoisIsraeliItalianJamaicanJapaneseJordanianKenyanKiowaKoreanLaotianLatvianLebaneseLiberianLithuanianLumbeeLuxembourgerMacedonianMalaysianMalteseMarshalleseMenomineeMexicanMexican American IndianMongolianMoroccanNative HawaiianNavajoNepaleseNew ZealanderNicaraguanNigerianNorthern EuropeanNorwegianOkinawanOsageOttawaPaiutePakistaniPalestinianPanamanianParaguayanPennsylvania GermanPeruvianPimaPolishPortuguesePotawatomiPuebloPuerto RicanPuget Sound SalishRomanianRussianSalvadoranSamoanScandinavianScotch-IrishScottishSeminoleSenegaleseSerbianShoshoneSierra LeoneanSiouxSlavicSlovakSloveneSomaliSouth AfricanSouth AmericanSouth American IndianSoviet UnionSpaniardSpanishSpanish AmericanSpanish American IndianSri LankanSubsaharan AfricanSudaneseSwedishSwissSyrianTaiwaneseThaiTlingit-HaidaTohono O'OdhamTonganTrinidadian and TobagonianTsimshianTurkishU.S. Virgin IslanderUgandanUkrainianUruguayanUteVenezuelanVietnameseWelshWest IndianYakamaYaquiYugoslavianYumanYup'ikZimbabwean
Immigration
NonimmigrantsImmigrantsAfghanistanAfricaAlbaniaArgentinaArmeniaAsiaAustraliaAustriaBahamasBangladeshBarbadosBelarusBelgiumBelizeBoliviaBosnia and HerzegovinaBrazilBulgariaBurma/MyanmarCabo VerdeCambodiaCameroonCanadaCaribbeanCentral AmericaChileChinaColombiaCongoCosta RicaCroatiaCubaCzechoslovakiaDenmarkDominicaDominican RepublicEastern AfricaEastern AsiaEastern EuropeEcuadorEgyptEl SalvadorEnglandEritreaEthiopiaEuropeFijiFranceGermanyGhanaGreeceGrenadaGuatemalaGuyanaHaitiHondurasHong KongHungaryIndiaIndonesiaIranIraqIrelandIsraelItalyJamaicaJapanJordanKazakhstanKenyaKoreaKuwaitLaosLatin AmericaLatviaLebanonLiberiaLithuaniaMalaysiaMexicoMicronesiaMiddle AfricaMoldovaMoroccoNepalNetherlandsNicaraguaNigeriaNorth AmericaNorth MacedoniaNorthern AfricaNorthern EuropeNorwayOceaniaPakistanPanamaPeruPhilippinesPolandPortugalRomaniaRussiaSaudi ArabiaScotlandSenegalSerbiaSierra LeoneSingaporeSomaliaSouth AfricaSouth AmericaSouth Central AsiaSouth Eastern AsiaSouthern EuropeSpainSri LankaSt. Vincent and the GrenadinesSudanSwedenSwitzerlandSyriaTaiwanTrinidad and TobagoTurkeyUgandaUkraineUruguayUzbekistanVenezuelaVietnamWest IndiesWestern AfricaWestern AsiaWestern EuropeYemenZaireZimbabweAzores
Immigrants from Thailand
Race
Ancestry
AfghanAfricanAlaska NativeAlaskan AthabascanAlbanianAleutAlsatianAmericanApacheArabArapahoArgentineanArmenianAssyrian/Chaldean/SyriacAustralianAustrianBahamianBangladeshiBarbadianBasqueBelgianBelizeanBermudanBhutaneseBlackfeetBolivianBrazilianBritishBritish West IndianBulgarianBurmeseCajunCambodianCanadianCape VerdeanCarpatho RusynCelticCentral AmericanCentral American IndianCherokeeCheyenneChickasawChileanChineseChippewaChoctawColombianColvilleComancheCosta RicanCreeCreekCrowCubanCypriotCzechCzechoslovakianDanishDelawareDominicanDutchDutch West IndianEastern EuropeanEcuadorianEgyptianEnglishEstonianEthiopianEuropeanFijianFilipinoFinnishFrenchFrench American IndianFrench CanadianGermanGerman RussianGhanaianGreekGuamanian/ChamorroGuatemalanGuyaneseHaitianHmongHonduranHopiHoumaHungarianIcelanderIndian (Asian)IndonesianInupiatIranianIraqiIrishIroquoisIsraeliItalianJamaicanJapaneseJordanianKenyanKiowaKoreanLaotianLatvianLebaneseLiberianLithuanianLumbeeLuxembourgerMacedonianMalaysianMalteseMarshalleseMenomineeMexicanMexican American IndianMongolianMoroccanNative HawaiianNavajoNepaleseNew ZealanderNicaraguanNigerianNorthern EuropeanNorwegianOkinawanOsageOttawaPaiutePakistaniPalestinianPanamanianParaguayanPennsylvania GermanPeruvianPimaPolishPortuguesePotawatomiPuebloPuerto RicanPuget Sound SalishRomanianRussianSalvadoranSamoanScandinavianScotch-IrishScottishSeminoleSenegaleseSerbianShoshoneSierra LeoneanSiouxSlavicSlovakSloveneSomaliSouth AfricanSouth AmericanSouth American IndianSoviet UnionSpaniardSpanishSpanish AmericanSpanish American IndianSri LankanSubsaharan AfricanSudaneseSwedishSwissSyrianTaiwaneseThaiTlingit-HaidaTohono O'OdhamTonganTrinidadian and TobagonianTsimshianTurkishU.S. Virgin IslanderUgandanUkrainianUruguayanUteVenezuelanVietnameseWelshWest IndianYakamaYaquiYugoslavianYumanYup'ikZimbabwean
Immigration
NonimmigrantsImmigrantsAfghanistanAfricaAlbaniaArgentinaArmeniaAsiaAustraliaAustriaBahamasBangladeshBarbadosBelarusBelgiumBelizeBoliviaBosnia and HerzegovinaBrazilBulgariaBurma/MyanmarCabo VerdeCambodiaCameroonCanadaCaribbeanCentral AmericaChileChinaColombiaCongoCosta RicaCroatiaCubaCzechoslovakiaDenmarkDominicaDominican RepublicEastern AfricaEastern AsiaEastern EuropeEcuadorEgyptEl SalvadorEnglandEritreaEthiopiaEuropeFijiFranceGermanyGhanaGreeceGrenadaGuatemalaGuyanaHaitiHondurasHong KongHungaryIndiaIndonesiaIranIraqIrelandIsraelItalyJamaicaJapanJordanKazakhstanKenyaKoreaKuwaitLaosLatin AmericaLatviaLebanonLiberiaLithuaniaMalaysiaMexicoMicronesiaMiddle AfricaMoldovaMoroccoNepalNetherlandsNicaraguaNigeriaNorth AmericaNorth MacedoniaNorthern AfricaNorthern EuropeNorwayOceaniaPakistanPanamaPeruPhilippinesPolandPortugalRomaniaRussiaSaudi ArabiaScotlandSenegalSerbiaSierra LeoneSingaporeSomaliaSouth AfricaSouth AmericaSouth Central AsiaSouth Eastern AsiaSouthern EuropeSpainSri LankaSt. Vincent and the GrenadinesSudanSwedenSwitzerlandSyriaTaiwanThailandTrinidad and TobagoTurkeyUgandaUkraineUruguayUzbekistanVenezuelaVietnamWest IndiesWestern AfricaWestern AsiaWestern EuropeYemenZaireZimbabweAzores
Unemployment Among Women with Children Under 6 years
Income
Poverty
Unemployment
Labor Participation
Family Structure
Vehicle Availability
Education Level
Disability

Unemployment Among Women with Children Under 6 years Comparison

Croatians

Immigrants from Thailand

Good
Fair
7.5%
UNEMPLOYMENT AMONG WOMEN WITH CHILDREN UNDER 6 YEARS
71.9/ 100
METRIC RATING
158th/ 347
METRIC RANK
7.7%
UNEMPLOYMENT AMONG WOMEN WITH CHILDREN UNDER 6 YEARS
38.5/ 100
METRIC RATING
187th/ 347
METRIC RANK

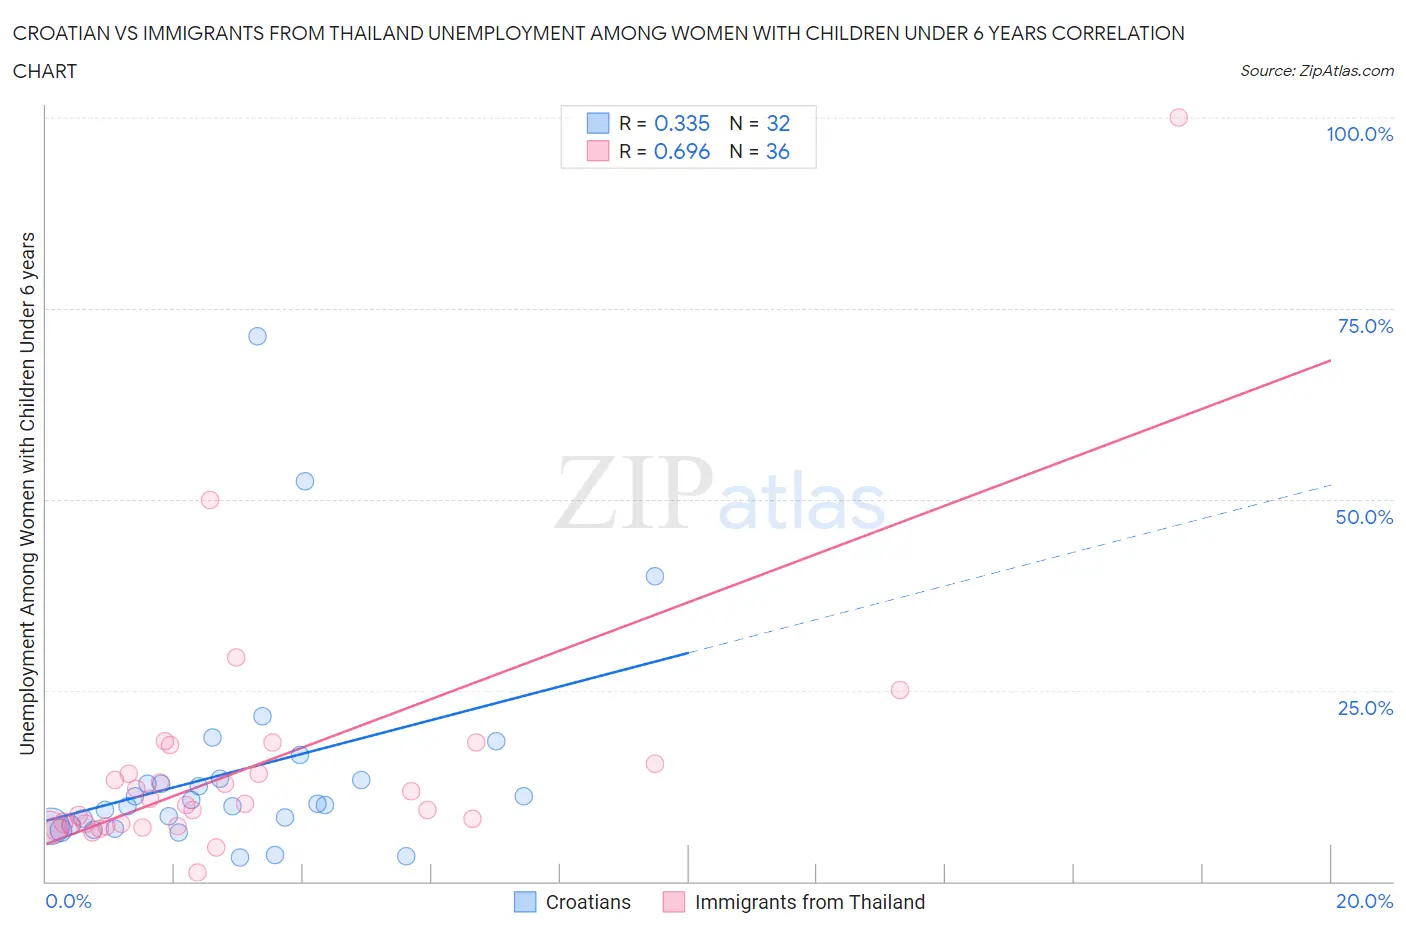
Croatian vs Immigrants from Thailand Unemployment Among Women with Children Under 6 years Correlation Chart

The statistical analysis conducted on geographies consisting of 279,151,645 people shows a mild positive correlation between the proportion of Croatians and unemployment rate among women with children under the age of 6 in the United States with a correlation coefficient (R) of 0.335 and weighted average of 7.5%. Similarly, the statistical analysis conducted on geographies consisting of 254,495,229 people shows a significant positive correlation between the proportion of Immigrants from Thailand and unemployment rate among women with children under the age of 6 in the United States with a correlation coefficient (R) of 0.696 and weighted average of 7.7%, a difference of 2.4%.
Croatian vs Immigrants from Thailand Unemployment Among Women with Children Under 6 years

Unemployment Among Women with Children Under 6 years Correlation Summary

MeasurementCroatianImmigrants from Thailand
Minimum3.1%1.1%
Maximum71.4%100.0%
Range68.3%98.9%
Mean14.4%14.8%
Median10.1%10.0%
Interquartile 25% (IQ1)7.3%7.2%
Interquartile 75% (IQ3)13.4%14.7%
Interquartile Range (IQR)6.1%7.5%
Standard Deviation (Sample)14.4%16.9%
Standard Deviation (Population)14.2%16.7%

Similar Demographics by Unemployment Among Women with Children Under 6 years

Demographics Similar to Croatians by Unemployment Among Women with Children Under 6 years

In terms of unemployment among women with children under 6 years, the demographic groups most similar to Croatians are Peruvian (7.5%, a difference of 0.030%), Immigrants from Philippines (7.5%, a difference of 0.050%), Bolivian (7.5%, a difference of 0.090%), Immigrants from Southern Europe (7.5%, a difference of 0.11%), and Immigrants from Western Asia (7.5%, a difference of 0.14%).
DemographicsRating | RankUnemployment Among Women with Children Under 6 years
Immigrants | Peru
74.9
/100
|
#151
Good
7.5%
Bangladeshis
74.8
/100
|
#152
Good
7.5%
Uruguayans
74.7
/100
|
#153
Good
7.5%
Northern Europeans
74.3
/100
|
#154
Good
7.5%
South Americans
74.1
/100
|
#155
Good
7.5%
Immigrants | Southern Europe
73.2
/100
|
#156
Good
7.5%
Peruvians
72.3
/100
|
#157
Good
7.5%
Croatians
71.9
/100
|
#158
Good
7.5%
Immigrants | Philippines
71.3
/100
|
#159
Good
7.5%
Bolivians
70.8
/100
|
#160
Good
7.5%
Immigrants | Western Asia
70.2
/100
|
#161
Good
7.5%
Immigrants | Lithuania
68.8
/100
|
#162
Good
7.5%
British
66.3
/100
|
#163
Good
7.6%
Ugandans
65.8
/100
|
#164
Good
7.6%
Immigrants | South America
65.6
/100
|
#165
Good
7.6%

Demographics Similar to Immigrants from Thailand by Unemployment Among Women with Children Under 6 years

In terms of unemployment among women with children under 6 years, the demographic groups most similar to Immigrants from Thailand are Czechoslovakian (7.7%, a difference of 0.010%), Yugoslavian (7.7%, a difference of 0.060%), Spanish American (7.7%, a difference of 0.080%), Indonesian (7.7%, a difference of 0.14%), and Immigrants from Panama (7.7%, a difference of 0.20%).
DemographicsRating | RankUnemployment Among Women with Children Under 6 years
Immigrants | Uruguay
44.5
/100
|
#180
Average
7.7%
Brazilians
43.9
/100
|
#181
Average
7.7%
Nepalese
43.5
/100
|
#182
Average
7.7%
Sierra Leoneans
42.9
/100
|
#183
Average
7.7%
Indonesians
40.5
/100
|
#184
Average
7.7%
Spanish Americans
39.7
/100
|
#185
Fair
7.7%
Yugoslavians
39.4
/100
|
#186
Fair
7.7%
Immigrants | Thailand
38.5
/100
|
#187
Fair
7.7%
Czechoslovakians
38.4
/100
|
#188
Fair
7.7%
Immigrants | Panama
35.7
/100
|
#189
Fair
7.7%
Immigrants | North Macedonia
34.4
/100
|
#190
Fair
7.7%
Immigrants | Austria
32.4
/100
|
#191
Fair
7.7%
Immigrants | Africa
32.4
/100
|
#192
Fair
7.7%
Slavs
32.4
/100
|
#193
Fair
7.7%
Syrians
31.9
/100
|
#194
Fair
7.7%