Yup'ik vs Immigrants from Thailand Median Family Income

COMPARE

Yup'ik
Race
Ancestry
AfghanAfricanAlaska NativeAlaskan AthabascanAlbanianAleutAlsatianAmericanApacheArabArapahoArgentineanArmenianAssyrian/Chaldean/SyriacAustralianAustrianBahamianBangladeshiBarbadianBasqueBelgianBelizeanBermudanBhutaneseBlackfeetBolivianBrazilianBritishBritish West IndianBulgarianBurmeseCajunCambodianCanadianCape VerdeanCarpatho RusynCelticCentral AmericanCentral American IndianCherokeeCheyenneChickasawChileanChineseChippewaChoctawColombianColvilleComancheCosta RicanCreeCreekCroatianCrowCubanCypriotCzechCzechoslovakianDanishDelawareDominicanDutchDutch West IndianEastern EuropeanEcuadorianEgyptianEnglishEstonianEthiopianEuropeanFijianFilipinoFinnishFrenchFrench American IndianFrench CanadianGermanGerman RussianGhanaianGreekGuamanian/ChamorroGuatemalanGuyaneseHaitianHmongHonduranHopiHoumaHungarianIcelanderIndian (Asian)IndonesianInupiatIranianIraqiIrishIroquoisIsraeliItalianJamaicanJapaneseJordanianKenyanKiowaKoreanLaotianLatvianLebaneseLiberianLithuanianLumbeeLuxembourgerMacedonianMalaysianMalteseMarshalleseMenomineeMexicanMexican American IndianMongolianMoroccanNative HawaiianNavajoNepaleseNew ZealanderNicaraguanNigerianNorthern EuropeanNorwegianOkinawanOsageOttawaPaiutePakistaniPalestinianPanamanianParaguayanPennsylvania GermanPeruvianPimaPolishPortuguesePotawatomiPuebloPuerto RicanPuget Sound SalishRomanianRussianSalvadoranSamoanScandinavianScotch-IrishScottishSeminoleSenegaleseSerbianShoshoneSierra LeoneanSiouxSlavicSlovakSloveneSomaliSouth AfricanSouth AmericanSouth American IndianSoviet UnionSpaniardSpanishSpanish AmericanSpanish American IndianSri LankanSubsaharan AfricanSudaneseSwedishSwissSyrianTaiwaneseThaiTlingit-HaidaTohono O'OdhamTonganTrinidadian and TobagonianTsimshianTurkishU.S. Virgin IslanderUgandanUkrainianUruguayanUteVenezuelanVietnameseWelshWest IndianYakamaYaquiYugoslavianYumanYup'ikZimbabwean
Immigration
NonimmigrantsImmigrantsAfghanistanAfricaAlbaniaArgentinaArmeniaAsiaAustraliaAustriaBahamasBangladeshBarbadosBelarusBelgiumBelizeBoliviaBosnia and HerzegovinaBrazilBulgariaBurma/MyanmarCabo VerdeCambodiaCameroonCanadaCaribbeanCentral AmericaChileChinaColombiaCongoCosta RicaCroatiaCubaCzechoslovakiaDenmarkDominicaDominican RepublicEastern AfricaEastern AsiaEastern EuropeEcuadorEgyptEl SalvadorEnglandEritreaEthiopiaEuropeFijiFranceGermanyGhanaGreeceGrenadaGuatemalaGuyanaHaitiHondurasHong KongHungaryIndiaIndonesiaIranIraqIrelandIsraelItalyJamaicaJapanJordanKazakhstanKenyaKoreaKuwaitLaosLatin AmericaLatviaLebanonLiberiaLithuaniaMalaysiaMexicoMicronesiaMiddle AfricaMoldovaMoroccoNepalNetherlandsNicaraguaNigeriaNorth AmericaNorth MacedoniaNorthern AfricaNorthern EuropeNorwayOceaniaPakistanPanamaPeruPhilippinesPolandPortugalRomaniaRussiaSaudi ArabiaScotlandSenegalSerbiaSierra LeoneSingaporeSomaliaSouth AfricaSouth AmericaSouth Central AsiaSouth Eastern AsiaSouthern EuropeSpainSri LankaSt. Vincent and the GrenadinesSudanSwedenSwitzerlandSyriaTaiwanTrinidad and TobagoTurkeyUgandaUkraineUruguayUzbekistanVenezuelaVietnamWest IndiesWestern AfricaWestern AsiaWestern EuropeYemenZaireZimbabweAzores
Immigrants from Thailand
Race
Ancestry
AfghanAfricanAlaska NativeAlaskan AthabascanAlbanianAleutAlsatianAmericanApacheArabArapahoArgentineanArmenianAssyrian/Chaldean/SyriacAustralianAustrianBahamianBangladeshiBarbadianBasqueBelgianBelizeanBermudanBhutaneseBlackfeetBolivianBrazilianBritishBritish West IndianBulgarianBurmeseCajunCambodianCanadianCape VerdeanCarpatho RusynCelticCentral AmericanCentral American IndianCherokeeCheyenneChickasawChileanChineseChippewaChoctawColombianColvilleComancheCosta RicanCreeCreekCroatianCrowCubanCypriotCzechCzechoslovakianDanishDelawareDominicanDutchDutch West IndianEastern EuropeanEcuadorianEgyptianEnglishEstonianEthiopianEuropeanFijianFilipinoFinnishFrenchFrench American IndianFrench CanadianGermanGerman RussianGhanaianGreekGuamanian/ChamorroGuatemalanGuyaneseHaitianHmongHonduranHopiHoumaHungarianIcelanderIndian (Asian)IndonesianInupiatIranianIraqiIrishIroquoisIsraeliItalianJamaicanJapaneseJordanianKenyanKiowaKoreanLaotianLatvianLebaneseLiberianLithuanianLumbeeLuxembourgerMacedonianMalaysianMalteseMarshalleseMenomineeMexicanMexican American IndianMongolianMoroccanNative HawaiianNavajoNepaleseNew ZealanderNicaraguanNigerianNorthern EuropeanNorwegianOkinawanOsageOttawaPaiutePakistaniPalestinianPanamanianParaguayanPennsylvania GermanPeruvianPimaPolishPortuguesePotawatomiPuebloPuerto RicanPuget Sound SalishRomanianRussianSalvadoranSamoanScandinavianScotch-IrishScottishSeminoleSenegaleseSerbianShoshoneSierra LeoneanSiouxSlavicSlovakSloveneSomaliSouth AfricanSouth AmericanSouth American IndianSoviet UnionSpaniardSpanishSpanish AmericanSpanish American IndianSri LankanSubsaharan AfricanSudaneseSwedishSwissSyrianTaiwaneseThaiTlingit-HaidaTohono O'OdhamTonganTrinidadian and TobagonianTsimshianTurkishU.S. Virgin IslanderUgandanUkrainianUruguayanUteVenezuelanVietnameseWelshWest IndianYakamaYaquiYugoslavianYumanZimbabwean
Immigration
NonimmigrantsImmigrantsAfghanistanAfricaAlbaniaArgentinaArmeniaAsiaAustraliaAustriaBahamasBangladeshBarbadosBelarusBelgiumBelizeBoliviaBosnia and HerzegovinaBrazilBulgariaBurma/MyanmarCabo VerdeCambodiaCameroonCanadaCaribbeanCentral AmericaChileChinaColombiaCongoCosta RicaCroatiaCubaCzechoslovakiaDenmarkDominicaDominican RepublicEastern AfricaEastern AsiaEastern EuropeEcuadorEgyptEl SalvadorEnglandEritreaEthiopiaEuropeFijiFranceGermanyGhanaGreeceGrenadaGuatemalaGuyanaHaitiHondurasHong KongHungaryIndiaIndonesiaIranIraqIrelandIsraelItalyJamaicaJapanJordanKazakhstanKenyaKoreaKuwaitLaosLatin AmericaLatviaLebanonLiberiaLithuaniaMalaysiaMexicoMicronesiaMiddle AfricaMoldovaMoroccoNepalNetherlandsNicaraguaNigeriaNorth AmericaNorth MacedoniaNorthern AfricaNorthern EuropeNorwayOceaniaPakistanPanamaPeruPhilippinesPolandPortugalRomaniaRussiaSaudi ArabiaScotlandSenegalSerbiaSierra LeoneSingaporeSomaliaSouth AfricaSouth AmericaSouth Central AsiaSouth Eastern AsiaSouthern EuropeSpainSri LankaSt. Vincent and the GrenadinesSudanSwedenSwitzerlandSyriaTaiwanThailandTrinidad and TobagoTurkeyUgandaUkraineUruguayUzbekistanVenezuelaVietnamWest IndiesWestern AfricaWestern AsiaWestern EuropeYemenZaireZimbabweAzores
Median Family Income
Income
Poverty
Unemployment
Labor Participation
Family Structure
Vehicle Availability
Education Level
Disability

Median Family Income Comparison

Yup'ik

Immigrants from Thailand

Tragic
Poor
$79,290
MEDIAN FAMILY INCOME
0.0/ 100
METRIC RATING
335th/ 347
METRIC RANK
$99,840
MEDIAN FAMILY INCOME
19.0/ 100
METRIC RATING
201st/ 347
METRIC RANK

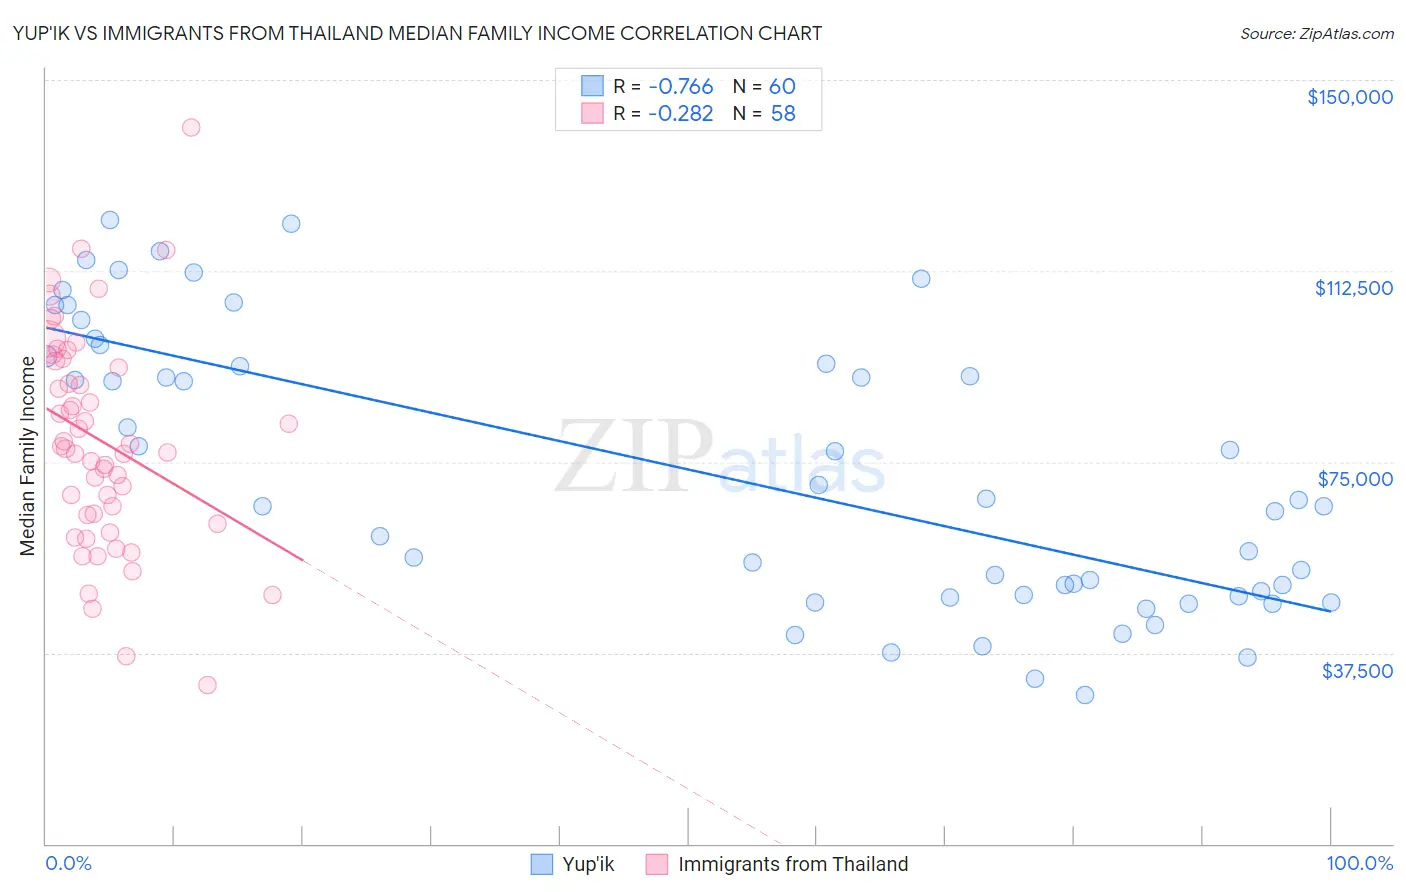
Yup'ik vs Immigrants from Thailand Median Family Income Correlation Chart

The statistical analysis conducted on geographies consisting of 39,952,310 people shows a strong negative correlation between the proportion of Yup'ik and median family income in the United States with a correlation coefficient (R) of -0.766 and weighted average of $79,290. Similarly, the statistical analysis conducted on geographies consisting of 316,887,320 people shows a weak negative correlation between the proportion of Immigrants from Thailand and median family income in the United States with a correlation coefficient (R) of -0.282 and weighted average of $99,840, a difference of 25.9%.
Yup'ik vs Immigrants from Thailand Median Family Income

Median Family Income Correlation Summary

MeasurementYup'ikImmigrants from Thailand
Minimum$29,250$31,250
Maximum$122,399$140,711
Range$93,149$109,461
Mean$72,637$79,142
Median$66,875$77,801
Interquartile 25% (IQ1)$48,824$64,533
Interquartile 75% (IQ3)$95,045$94,707
Interquartile Range (IQR)$46,221$30,174
Standard Deviation (Sample)$27,024$21,144
Standard Deviation (Population)$26,798$20,961

Similar Demographics by Median Family Income

Demographics Similar to Yup'ik by Median Family Income

In terms of median family income, the demographic groups most similar to Yup'ik are Menominee ($79,563, a difference of 0.34%), Immigrants from Cuba ($78,249, a difference of 1.3%), Yuman ($78,055, a difference of 1.6%), Kiowa ($80,885, a difference of 2.0%), and Native/Alaskan ($80,908, a difference of 2.0%).
DemographicsRating | RankMedian Family Income
Blacks/African Americans
0.0
/100
|
#328
Tragic
$81,912
Dutch West Indians
0.0
/100
|
#329
Tragic
$81,852
Cheyenne
0.0
/100
|
#330
Tragic
$81,385
Immigrants | Dominican Republic
0.0
/100
|
#331
Tragic
$81,233
Natives/Alaskans
0.0
/100
|
#332
Tragic
$80,908
Kiowa
0.0
/100
|
#333
Tragic
$80,885
Menominee
0.0
/100
|
#334
Tragic
$79,563
Yup'ik
0.0
/100
|
#335
Tragic
$79,290
Immigrants | Cuba
0.0
/100
|
#336
Tragic
$78,249
Yuman
0.0
/100
|
#337
Tragic
$78,055
Immigrants | Yemen
0.0
/100
|
#338
Tragic
$77,457
Pima
0.0
/100
|
#339
Tragic
$77,431
Hopi
0.0
/100
|
#340
Tragic
$77,188
Pueblo
0.0
/100
|
#341
Tragic
$76,880
Crow
0.0
/100
|
#342
Tragic
$76,605

Demographics Similar to Immigrants from Thailand by Median Family Income

In terms of median family income, the demographic groups most similar to Immigrants from Thailand are White/Caucasian ($99,800, a difference of 0.040%), Spanish ($99,977, a difference of 0.14%), Scotch-Irish ($99,591, a difference of 0.25%), Yugoslavian ($100,119, a difference of 0.28%), and Immigrants from Africa ($100,256, a difference of 0.42%).
DemographicsRating | RankMedian Family Income
Uruguayans
26.3
/100
|
#194
Fair
$100,656
Immigrants | South America
23.9
/100
|
#195
Fair
$100,414
Samoans
23.3
/100
|
#196
Fair
$100,344
Immigrants | Cameroon
22.8
/100
|
#197
Fair
$100,289
Immigrants | Africa
22.5
/100
|
#198
Fair
$100,256
Yugoslavians
21.3
/100
|
#199
Fair
$100,119
Spanish
20.1
/100
|
#200
Fair
$99,977
Immigrants | Thailand
19.0
/100
|
#201
Poor
$99,840
Whites/Caucasians
18.7
/100
|
#202
Poor
$99,800
Scotch-Irish
17.1
/100
|
#203
Poor
$99,591
Ghanaians
12.6
/100
|
#204
Poor
$98,877
Hawaiians
12.5
/100
|
#205
Poor
$98,869
Immigrants | Iraq
12.1
/100
|
#206
Poor
$98,786
Aleuts
11.6
/100
|
#207
Poor
$98,702
Immigrants | Uruguay
9.2
/100
|
#208
Tragic
$98,205