Croatian vs Immigrants from Africa Householder Income Ages 25 - 44 years
COMPARE
Croatian
Immigrants from Africa
Householder Income Ages 25 - 44 years
Householder Income Ages 25 - 44 years Comparison
Croatians
Immigrants from Africa
$102,414
HOUSEHOLDER INCOME AGES 25 - 44 YEARS
98.7/ 100
METRIC RATING
91st/ 347
METRIC RANK
$90,372
HOUSEHOLDER INCOME AGES 25 - 44 YEARS
8.9/ 100
METRIC RATING
214th/ 347
METRIC RANK
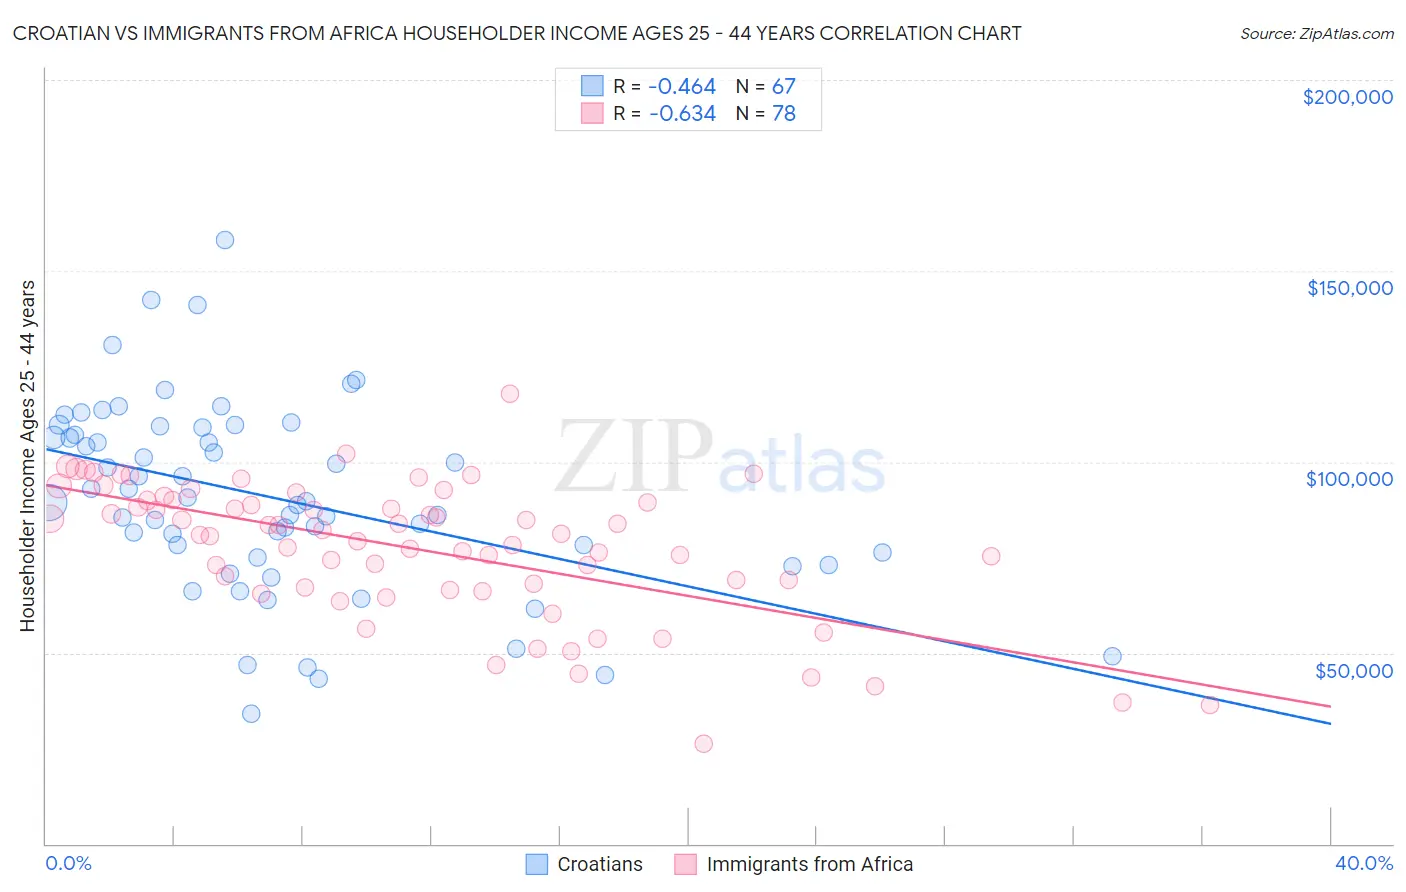
Croatian vs Immigrants from Africa Householder Income Ages 25 - 44 years Correlation Chart
The statistical analysis conducted on geographies consisting of 374,641,532 people shows a moderate negative correlation between the proportion of Croatians and household income with householder between the ages 25 and 44 in the United States with a correlation coefficient (R) of -0.464 and weighted average of $102,414. Similarly, the statistical analysis conducted on geographies consisting of 467,630,423 people shows a significant negative correlation between the proportion of Immigrants from Africa and household income with householder between the ages 25 and 44 in the United States with a correlation coefficient (R) of -0.634 and weighted average of $90,372, a difference of 13.3%.
Householder Income Ages 25 - 44 years Correlation Summary
| Measurement | Croatian | Immigrants from Africa |
| Minimum | $33,958 | $26,250 |
| Maximum | $158,158 | $117,804 |
| Range | $124,200 | $91,554 |
| Mean | $90,676 | $77,244 |
| Median | $89,581 | $81,060 |
| Interquartile 25% (IQ1) | $75,000 | $67,103 |
| Interquartile 75% (IQ3) | $109,113 | $89,908 |
| Interquartile Range (IQR) | $34,113 | $22,805 |
| Standard Deviation (Sample) | $25,045 | $17,876 |
| Standard Deviation (Population) | $24,857 | $17,761 |
Similar Demographics by Householder Income Ages 25 - 44 years
Demographics Similar to Croatians by Householder Income Ages 25 - 44 years
In terms of householder income ages 25 - 44 years, the demographic groups most similar to Croatians are Immigrants from North America ($102,407, a difference of 0.010%), Ukrainian ($102,451, a difference of 0.040%), Romanian ($102,544, a difference of 0.13%), Immigrants from Canada ($102,616, a difference of 0.20%), and Immigrants from Western Europe ($102,654, a difference of 0.23%).
| Demographics | Rating | Rank | Householder Income Ages 25 - 44 years |
| Immigrants | Philippines | 99.0 /100 | #84 | Exceptional $102,910 |
| Immigrants | Ukraine | 98.9 /100 | #85 | Exceptional $102,664 |
| Immigrants | Hungary | 98.9 /100 | #86 | Exceptional $102,655 |
| Immigrants | Western Europe | 98.9 /100 | #87 | Exceptional $102,654 |
| Immigrants | Canada | 98.9 /100 | #88 | Exceptional $102,616 |
| Romanians | 98.8 /100 | #89 | Exceptional $102,544 |
| Ukrainians | 98.8 /100 | #90 | Exceptional $102,451 |
| Croatians | 98.7 /100 | #91 | Exceptional $102,414 |
| Immigrants | North America | 98.7 /100 | #92 | Exceptional $102,407 |
| Immigrants | England | 98.4 /100 | #93 | Exceptional $102,020 |
| Sri Lankans | 98.4 /100 | #94 | Exceptional $101,960 |
| Assyrians/Chaldeans/Syriacs | 98.3 /100 | #95 | Exceptional $101,936 |
| Macedonians | 98.3 /100 | #96 | Exceptional $101,882 |
| Austrians | 98.3 /100 | #97 | Exceptional $101,842 |
| Immigrants | Kazakhstan | 98.1 /100 | #98 | Exceptional $101,727 |
Demographics Similar to Immigrants from Africa by Householder Income Ages 25 - 44 years
In terms of householder income ages 25 - 44 years, the demographic groups most similar to Immigrants from Africa are Immigrants from Bangladesh ($90,448, a difference of 0.090%), Panamanian ($90,193, a difference of 0.20%), Ghanaian ($90,137, a difference of 0.26%), Hawaiian ($90,722, a difference of 0.39%), and Iraqi ($90,764, a difference of 0.43%).
| Demographics | Rating | Rank | Householder Income Ages 25 - 44 years |
| Yugoslavians | 14.5 /100 | #207 | Poor $91,368 |
| Immigrants | Thailand | 14.3 /100 | #208 | Poor $91,337 |
| Immigrants | Uruguay | 13.2 /100 | #209 | Poor $91,171 |
| Immigrants | Kenya | 10.9 /100 | #210 | Poor $90,767 |
| Iraqis | 10.8 /100 | #211 | Poor $90,764 |
| Hawaiians | 10.6 /100 | #212 | Poor $90,722 |
| Immigrants | Bangladesh | 9.3 /100 | #213 | Tragic $90,448 |
| Immigrants | Africa | 8.9 /100 | #214 | Tragic $90,372 |
| Panamanians | 8.1 /100 | #215 | Tragic $90,193 |
| Ghanaians | 7.9 /100 | #216 | Tragic $90,137 |
| Scotch-Irish | 7.3 /100 | #217 | Tragic $89,969 |
| Guyanese | 7.1 /100 | #218 | Tragic $89,940 |
| Delaware | 6.9 /100 | #219 | Tragic $89,876 |
| Trinidadians and Tobagonians | 6.8 /100 | #220 | Tragic $89,856 |
| Immigrants | Trinidad and Tobago | 6.5 /100 | #221 | Tragic $89,748 |