Croatian vs Apache Householder Income Ages 25 - 44 years
COMPARE
Croatian
Apache
Householder Income Ages 25 - 44 years
Householder Income Ages 25 - 44 years Comparison
Croatians
Apache
$102,414
HOUSEHOLDER INCOME AGES 25 - 44 YEARS
98.7/ 100
METRIC RATING
91st/ 347
METRIC RANK
$80,260
HOUSEHOLDER INCOME AGES 25 - 44 YEARS
0.0/ 100
METRIC RATING
306th/ 347
METRIC RANK
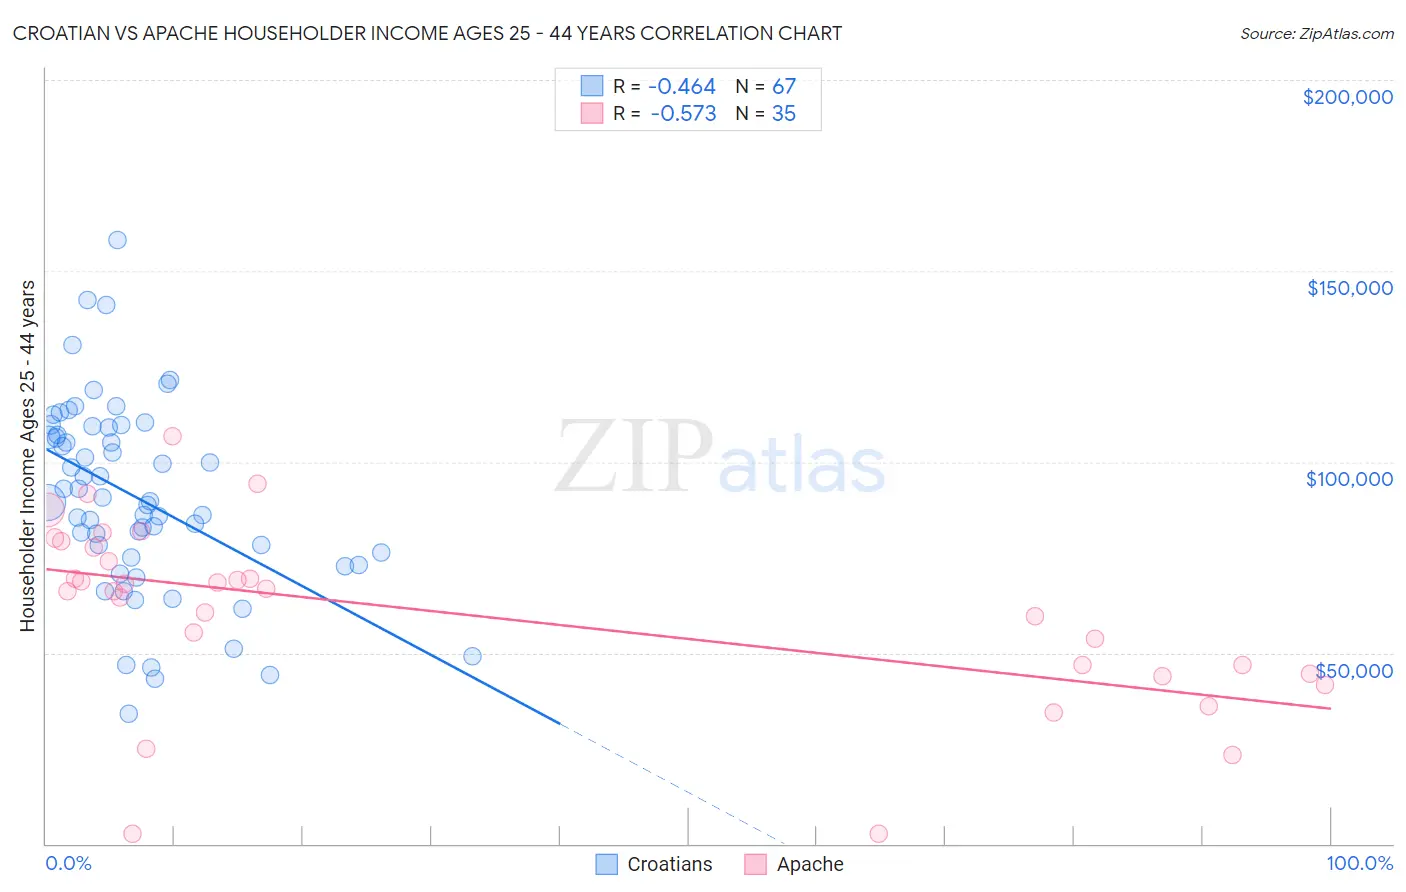
Croatian vs Apache Householder Income Ages 25 - 44 years Correlation Chart
The statistical analysis conducted on geographies consisting of 374,641,532 people shows a moderate negative correlation between the proportion of Croatians and household income with householder between the ages 25 and 44 in the United States with a correlation coefficient (R) of -0.464 and weighted average of $102,414. Similarly, the statistical analysis conducted on geographies consisting of 230,671,179 people shows a substantial negative correlation between the proportion of Apache and household income with householder between the ages 25 and 44 in the United States with a correlation coefficient (R) of -0.573 and weighted average of $80,260, a difference of 27.6%.
Householder Income Ages 25 - 44 years Correlation Summary
| Measurement | Croatian | Apache |
| Minimum | $33,958 | $2,499 |
| Maximum | $158,158 | $106,561 |
| Range | $124,200 | $104,062 |
| Mean | $90,676 | $60,213 |
| Median | $89,581 | $66,174 |
| Interquartile 25% (IQ1) | $75,000 | $44,643 |
| Interquartile 75% (IQ3) | $109,113 | $77,529 |
| Interquartile Range (IQR) | $34,113 | $32,886 |
| Standard Deviation (Sample) | $25,045 | $24,023 |
| Standard Deviation (Population) | $24,857 | $23,677 |
Similar Demographics by Householder Income Ages 25 - 44 years
Demographics Similar to Croatians by Householder Income Ages 25 - 44 years
In terms of householder income ages 25 - 44 years, the demographic groups most similar to Croatians are Immigrants from North America ($102,407, a difference of 0.010%), Ukrainian ($102,451, a difference of 0.040%), Romanian ($102,544, a difference of 0.13%), Immigrants from Canada ($102,616, a difference of 0.20%), and Immigrants from Western Europe ($102,654, a difference of 0.23%).
| Demographics | Rating | Rank | Householder Income Ages 25 - 44 years |
| Immigrants | Philippines | 99.0 /100 | #84 | Exceptional $102,910 |
| Immigrants | Ukraine | 98.9 /100 | #85 | Exceptional $102,664 |
| Immigrants | Hungary | 98.9 /100 | #86 | Exceptional $102,655 |
| Immigrants | Western Europe | 98.9 /100 | #87 | Exceptional $102,654 |
| Immigrants | Canada | 98.9 /100 | #88 | Exceptional $102,616 |
| Romanians | 98.8 /100 | #89 | Exceptional $102,544 |
| Ukrainians | 98.8 /100 | #90 | Exceptional $102,451 |
| Croatians | 98.7 /100 | #91 | Exceptional $102,414 |
| Immigrants | North America | 98.7 /100 | #92 | Exceptional $102,407 |
| Immigrants | England | 98.4 /100 | #93 | Exceptional $102,020 |
| Sri Lankans | 98.4 /100 | #94 | Exceptional $101,960 |
| Assyrians/Chaldeans/Syriacs | 98.3 /100 | #95 | Exceptional $101,936 |
| Macedonians | 98.3 /100 | #96 | Exceptional $101,882 |
| Austrians | 98.3 /100 | #97 | Exceptional $101,842 |
| Immigrants | Kazakhstan | 98.1 /100 | #98 | Exceptional $101,727 |
Demographics Similar to Apache by Householder Income Ages 25 - 44 years
In terms of householder income ages 25 - 44 years, the demographic groups most similar to Apache are Immigrants from Dominican Republic ($80,319, a difference of 0.070%), Immigrants from Caribbean ($80,326, a difference of 0.080%), Mexican ($80,427, a difference of 0.21%), Haitian ($80,055, a difference of 0.26%), and Immigrants from Central America ($80,012, a difference of 0.31%).
| Demographics | Rating | Rank | Householder Income Ages 25 - 44 years |
| Immigrants | Liberia | 0.1 /100 | #299 | Tragic $80,863 |
| Cherokee | 0.0 /100 | #300 | Tragic $80,843 |
| Immigrants | Micronesia | 0.0 /100 | #301 | Tragic $80,544 |
| Hispanics or Latinos | 0.0 /100 | #302 | Tragic $80,515 |
| Mexicans | 0.0 /100 | #303 | Tragic $80,427 |
| Immigrants | Caribbean | 0.0 /100 | #304 | Tragic $80,326 |
| Immigrants | Dominican Republic | 0.0 /100 | #305 | Tragic $80,319 |
| Apache | 0.0 /100 | #306 | Tragic $80,260 |
| Haitians | 0.0 /100 | #307 | Tragic $80,055 |
| Immigrants | Central America | 0.0 /100 | #308 | Tragic $80,012 |
| Chippewa | 0.0 /100 | #309 | Tragic $80,005 |
| Fijians | 0.0 /100 | #310 | Tragic $79,956 |
| Indonesians | 0.0 /100 | #311 | Tragic $79,543 |
| Immigrants | Haiti | 0.0 /100 | #312 | Tragic $79,391 |
| Menominee | 0.0 /100 | #313 | Tragic $79,358 |