Immigrants from Northern Europe vs Osage Median Family Income
COMPARE
Immigrants from Northern Europe
Osage
Median Family Income
Median Family Income Comparison
Immigrants from Northern Europe
Osage
$121,840
MEDIAN FAMILY INCOME
100.0/ 100
METRIC RATING
24th/ 347
METRIC RANK
$91,926
MEDIAN FAMILY INCOME
0.4/ 100
METRIC RATING
258th/ 347
METRIC RANK
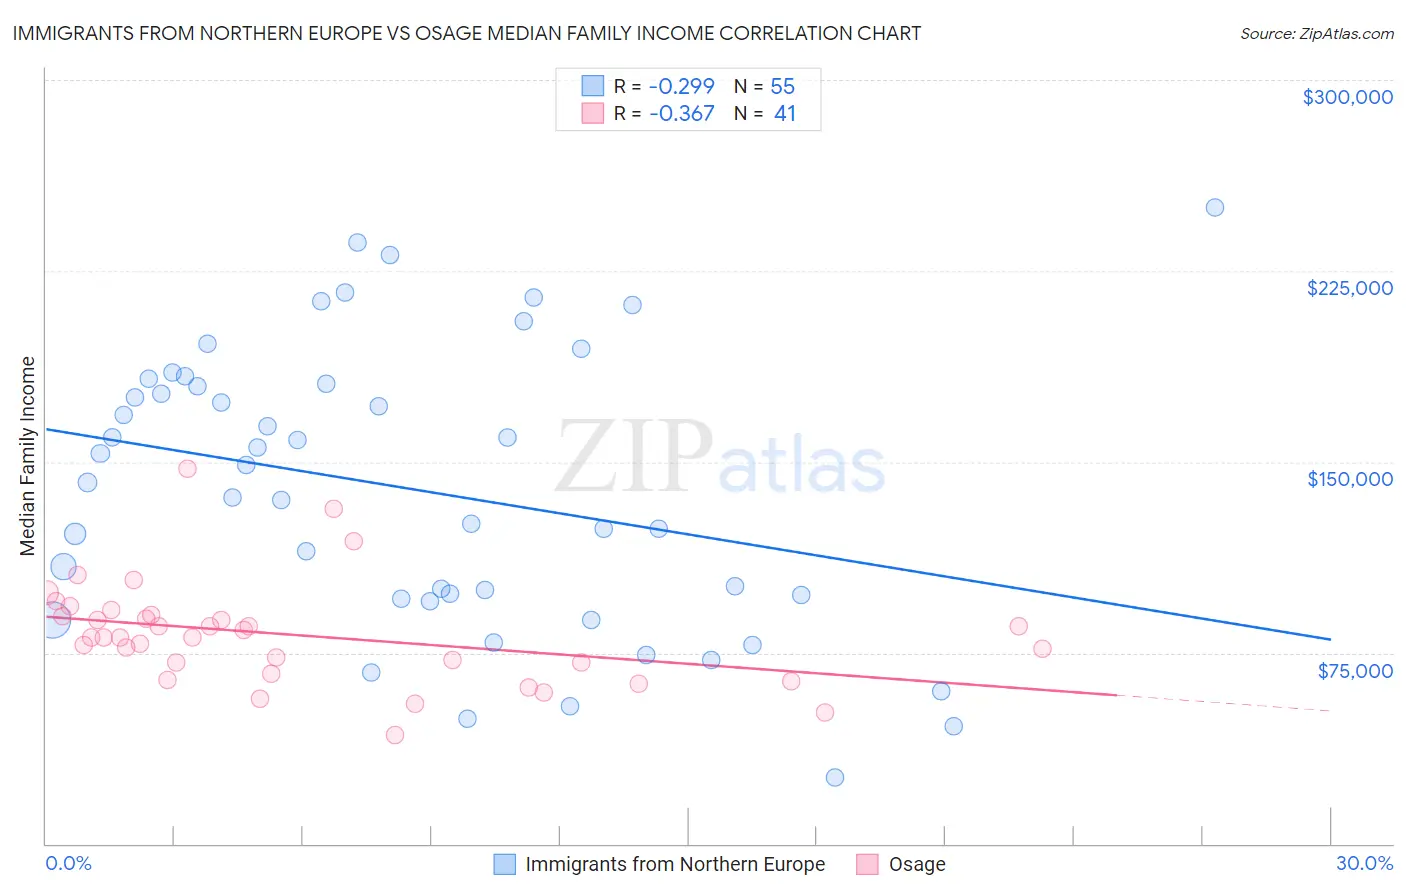
Immigrants from Northern Europe vs Osage Median Family Income Correlation Chart
The statistical analysis conducted on geographies consisting of 476,742,479 people shows a weak negative correlation between the proportion of Immigrants from Northern Europe and median family income in the United States with a correlation coefficient (R) of -0.299 and weighted average of $121,840. Similarly, the statistical analysis conducted on geographies consisting of 91,794,477 people shows a mild negative correlation between the proportion of Osage and median family income in the United States with a correlation coefficient (R) of -0.367 and weighted average of $91,926, a difference of 32.5%.
Median Family Income Correlation Summary
| Measurement | Immigrants from Northern Europe | Osage |
| Minimum | $26,250 | $42,500 |
| Maximum | $250,001 | $147,522 |
| Range | $223,751 | $105,022 |
| Mean | $139,082 | $81,978 |
| Median | $142,088 | $81,165 |
| Interquartile 25% (IQ1) | $96,250 | $68,927 |
| Interquartile 75% (IQ3) | $180,658 | $89,553 |
| Interquartile Range (IQR) | $84,408 | $20,626 |
| Standard Deviation (Sample) | $55,193 | $20,387 |
| Standard Deviation (Population) | $54,689 | $20,137 |
Similar Demographics by Median Family Income
Demographics Similar to Immigrants from Northern Europe by Median Family Income
In terms of median family income, the demographic groups most similar to Immigrants from Northern Europe are Turkish ($121,202, a difference of 0.53%), Immigrants from Sweden ($122,765, a difference of 0.76%), Immigrants from Japan ($122,764, a difference of 0.76%), Immigrants from Korea ($122,800, a difference of 0.79%), and Immigrants from Switzerland ($120,726, a difference of 0.92%).
| Demographics | Rating | Rank | Median Family Income |
| Indians (Asian) | 100.0 /100 | #17 | Exceptional $125,312 |
| Immigrants | Eastern Asia | 100.0 /100 | #18 | Exceptional $125,150 |
| Immigrants | Belgium | 100.0 /100 | #19 | Exceptional $123,831 |
| Burmese | 100.0 /100 | #20 | Exceptional $123,369 |
| Immigrants | Korea | 100.0 /100 | #21 | Exceptional $122,800 |
| Immigrants | Sweden | 100.0 /100 | #22 | Exceptional $122,765 |
| Immigrants | Japan | 100.0 /100 | #23 | Exceptional $122,764 |
| Immigrants | Northern Europe | 100.0 /100 | #24 | Exceptional $121,840 |
| Turks | 100.0 /100 | #25 | Exceptional $121,202 |
| Immigrants | Switzerland | 100.0 /100 | #26 | Exceptional $120,726 |
| Russians | 100.0 /100 | #27 | Exceptional $120,487 |
| Immigrants | Denmark | 100.0 /100 | #28 | Exceptional $120,445 |
| Latvians | 100.0 /100 | #29 | Exceptional $120,301 |
| Immigrants | Sri Lanka | 100.0 /100 | #30 | Exceptional $120,263 |
| Immigrants | France | 100.0 /100 | #31 | Exceptional $120,076 |
Demographics Similar to Osage by Median Family Income
In terms of median family income, the demographic groups most similar to Osage are Cape Verdean ($91,848, a difference of 0.090%), Pennsylvania German ($91,763, a difference of 0.18%), American ($92,096, a difference of 0.19%), Inupiat ($91,730, a difference of 0.21%), and Liberian ($91,722, a difference of 0.22%).
| Demographics | Rating | Rank | Median Family Income |
| Immigrants | Somalia | 0.6 /100 | #251 | Tragic $92,609 |
| Immigrants | El Salvador | 0.6 /100 | #252 | Tragic $92,545 |
| Immigrants | Guyana | 0.6 /100 | #253 | Tragic $92,513 |
| Immigrants | Barbados | 0.5 /100 | #254 | Tragic $92,419 |
| Immigrants | Laos | 0.5 /100 | #255 | Tragic $92,239 |
| Nicaraguans | 0.5 /100 | #256 | Tragic $92,231 |
| Americans | 0.4 /100 | #257 | Tragic $92,096 |
| Osage | 0.4 /100 | #258 | Tragic $91,926 |
| Cape Verdeans | 0.4 /100 | #259 | Tragic $91,848 |
| Pennsylvania Germans | 0.4 /100 | #260 | Tragic $91,763 |
| Inupiat | 0.4 /100 | #261 | Tragic $91,730 |
| Liberians | 0.4 /100 | #262 | Tragic $91,722 |
| Immigrants | West Indies | 0.3 /100 | #263 | Tragic $91,588 |
| Senegalese | 0.3 /100 | #264 | Tragic $91,475 |
| Hmong | 0.3 /100 | #265 | Tragic $91,296 |