Creek vs Osage Family Households with Children
COMPARE
Creek
Osage
Family Households with Children
Family Households with Children Comparison
Creek
Osage
27.4%
FAMILY HOUSEHOLDS WITH CHILDREN
39.8/ 100
METRIC RATING
187th/ 347
METRIC RANK
27.6%
FAMILY HOUSEHOLDS WITH CHILDREN
79.0/ 100
METRIC RATING
148th/ 347
METRIC RANK
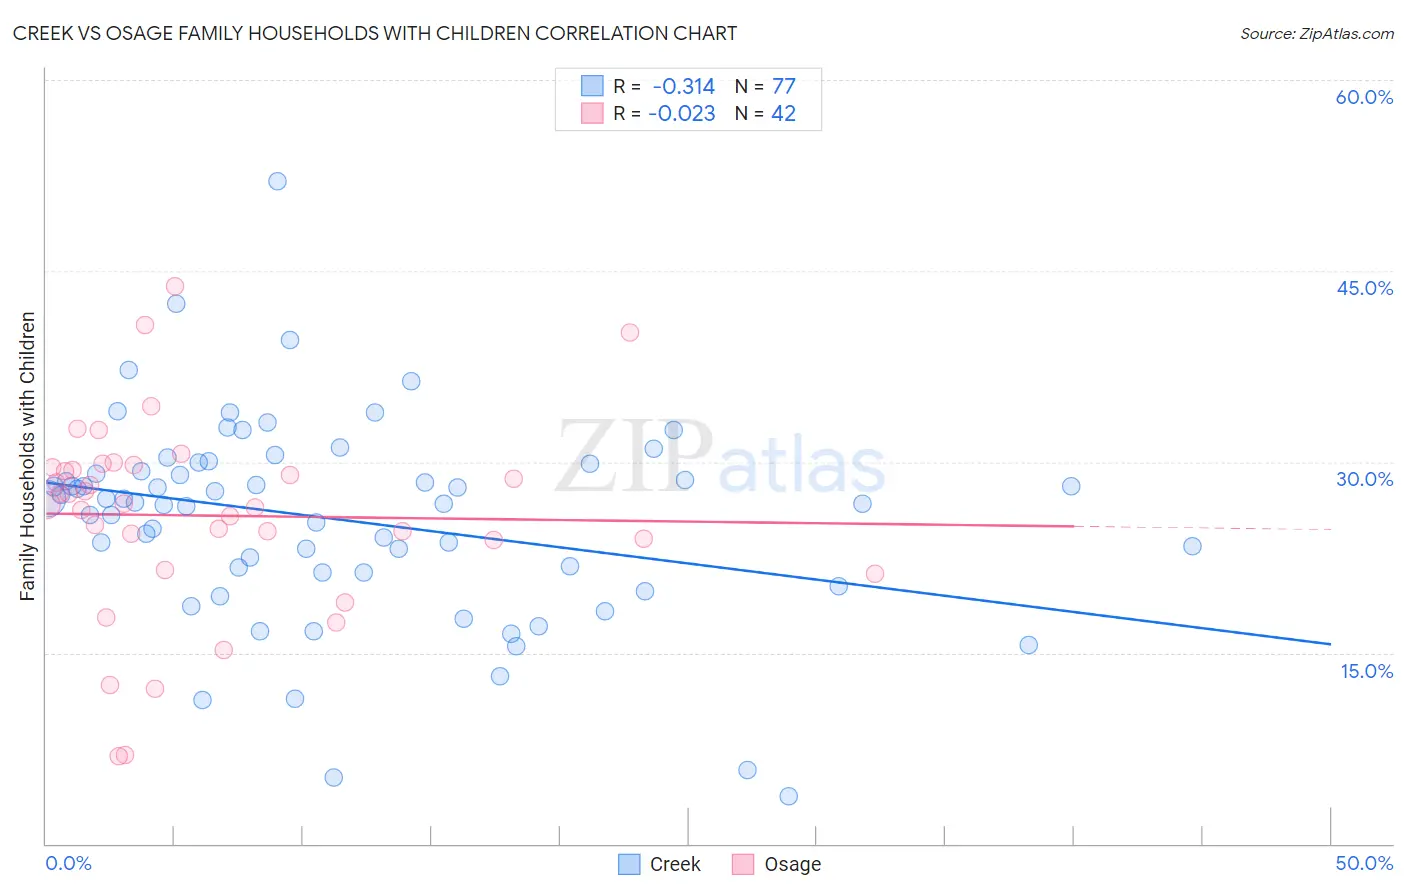
Creek vs Osage Family Households with Children Correlation Chart
The statistical analysis conducted on geographies consisting of 178,422,790 people shows a mild negative correlation between the proportion of Creek and percentage of family households with children in the United States with a correlation coefficient (R) of -0.314 and weighted average of 27.4%. Similarly, the statistical analysis conducted on geographies consisting of 91,796,912 people shows no correlation between the proportion of Osage and percentage of family households with children in the United States with a correlation coefficient (R) of -0.023 and weighted average of 27.6%, a difference of 0.96%.
Family Households with Children Correlation Summary
| Measurement | Creek | Osage |
| Minimum | 3.8% | 6.8% |
| Maximum | 52.1% | 43.8% |
| Range | 48.3% | 36.9% |
| Mean | 25.4% | 25.8% |
| Median | 26.8% | 26.7% |
| Interquartile 25% (IQ1) | 21.3% | 23.9% |
| Interquartile 75% (IQ3) | 29.6% | 29.6% |
| Interquartile Range (IQR) | 8.2% | 5.7% |
| Standard Deviation (Sample) | 8.0% | 7.8% |
| Standard Deviation (Population) | 7.9% | 7.7% |
Similar Demographics by Family Households with Children
Demographics Similar to Creek by Family Households with Children
In terms of family households with children, the demographic groups most similar to Creek are Immigrants from Brazil (27.4%, a difference of 0.020%), Dutch (27.4%, a difference of 0.020%), Immigrants from Israel (27.4%, a difference of 0.040%), Delaware (27.4%, a difference of 0.050%), and Immigrants from Uruguay (27.4%, a difference of 0.050%).
| Demographics | Rating | Rank | Family Households with Children |
| Immigrants | Turkey | 46.9 /100 | #180 | Average 27.4% |
| Aleuts | 46.7 /100 | #181 | Average 27.4% |
| Puget Sound Salish | 46.2 /100 | #182 | Average 27.4% |
| South Africans | 44.9 /100 | #183 | Average 27.4% |
| Native Hawaiians | 44.6 /100 | #184 | Average 27.4% |
| Delaware | 42.0 /100 | #185 | Average 27.4% |
| Immigrants | Brazil | 40.6 /100 | #186 | Average 27.4% |
| Creek | 39.8 /100 | #187 | Fair 27.4% |
| Dutch | 38.8 /100 | #188 | Fair 27.4% |
| Immigrants | Israel | 37.9 /100 | #189 | Fair 27.4% |
| Immigrants | Uruguay | 37.7 /100 | #190 | Fair 27.4% |
| Sudanese | 37.6 /100 | #191 | Fair 27.4% |
| Pennsylvania Germans | 37.5 /100 | #192 | Fair 27.4% |
| Swedes | 36.9 /100 | #193 | Fair 27.4% |
| Immigrants | Iran | 36.1 /100 | #194 | Fair 27.4% |
Demographics Similar to Osage by Family Households with Children
In terms of family households with children, the demographic groups most similar to Osage are Immigrants from Moldova (27.6%, a difference of 0.0%), Menominee (27.6%, a difference of 0.0%), Brazilian (27.7%, a difference of 0.020%), Immigrants from Chile (27.7%, a difference of 0.020%), and Basque (27.7%, a difference of 0.020%).
| Demographics | Rating | Rank | Family Households with Children |
| Immigrants | Eastern Asia | 81.7 /100 | #141 | Excellent 27.7% |
| Swiss | 81.4 /100 | #142 | Excellent 27.7% |
| Immigrants | Eastern Africa | 80.2 /100 | #143 | Excellent 27.7% |
| Brazilians | 79.6 /100 | #144 | Good 27.7% |
| Immigrants | Chile | 79.5 /100 | #145 | Good 27.7% |
| Basques | 79.5 /100 | #146 | Good 27.7% |
| Immigrants | Moldova | 79.1 /100 | #147 | Good 27.6% |
| Osage | 79.0 /100 | #148 | Good 27.6% |
| Menominee | 78.9 /100 | #149 | Good 27.6% |
| Argentineans | 78.5 /100 | #150 | Good 27.6% |
| Portuguese | 77.8 /100 | #151 | Good 27.6% |
| Ethiopians | 77.0 /100 | #152 | Good 27.6% |
| Immigrants | Cabo Verde | 75.6 /100 | #153 | Good 27.6% |
| Icelanders | 75.3 /100 | #154 | Good 27.6% |
| Comanche | 74.8 /100 | #155 | Good 27.6% |