Bermudan vs Osage Median Family Income
COMPARE
Bermudan
Osage
Median Family Income
Median Family Income Comparison
Bermudans
Osage
$97,577
MEDIAN FAMILY INCOME
6.9/ 100
METRIC RATING
214th/ 347
METRIC RANK
$91,926
MEDIAN FAMILY INCOME
0.4/ 100
METRIC RATING
258th/ 347
METRIC RANK
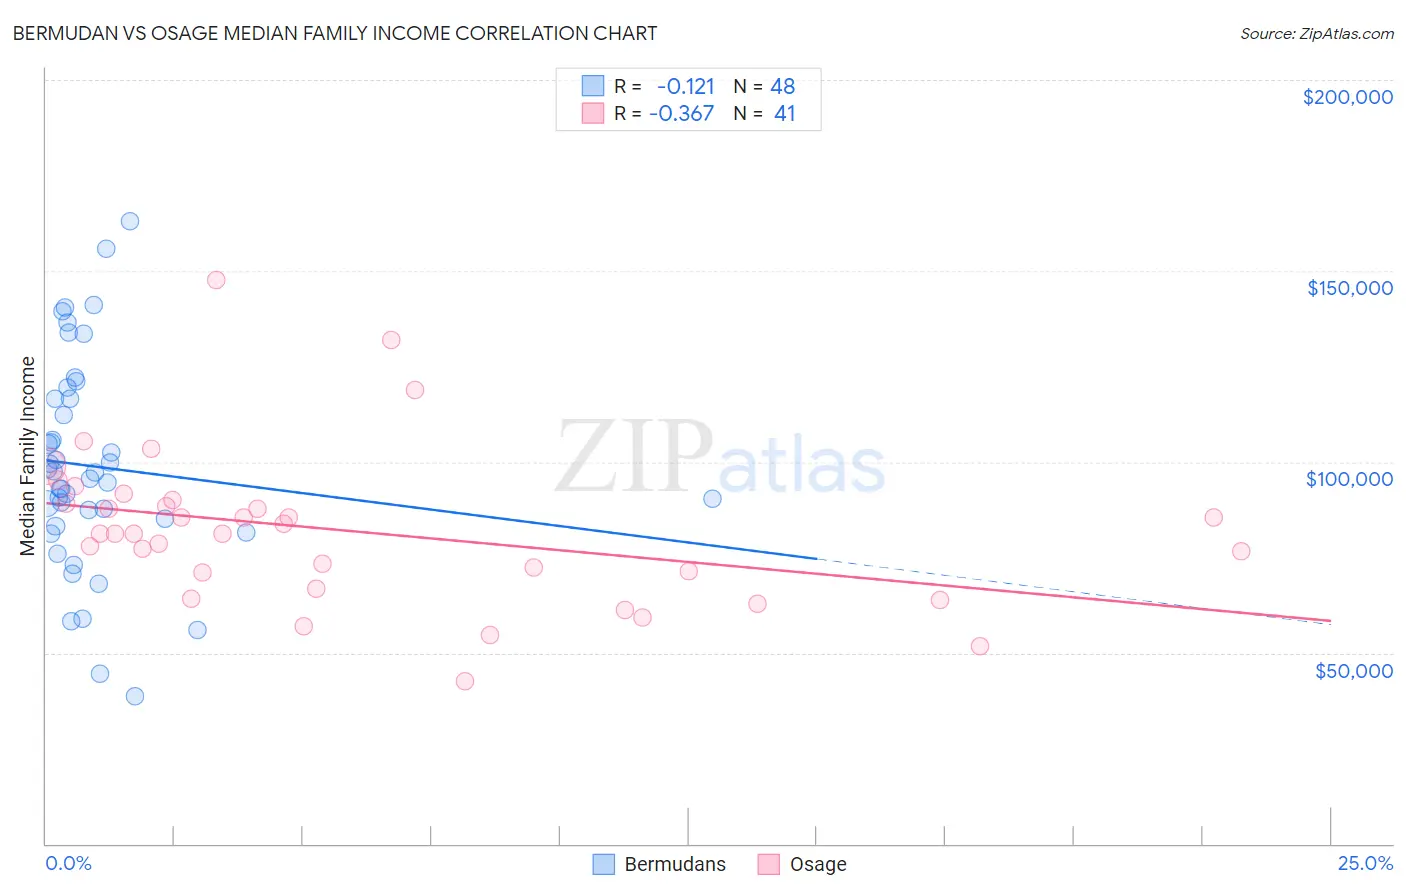
Bermudan vs Osage Median Family Income Correlation Chart
The statistical analysis conducted on geographies consisting of 55,709,060 people shows a poor negative correlation between the proportion of Bermudans and median family income in the United States with a correlation coefficient (R) of -0.121 and weighted average of $97,577. Similarly, the statistical analysis conducted on geographies consisting of 91,794,477 people shows a mild negative correlation between the proportion of Osage and median family income in the United States with a correlation coefficient (R) of -0.367 and weighted average of $91,926, a difference of 6.1%.
Median Family Income Correlation Summary
| Measurement | Bermudan | Osage |
| Minimum | $38,750 | $42,500 |
| Maximum | $163,000 | $147,522 |
| Range | $124,250 | $105,022 |
| Mean | $98,727 | $81,978 |
| Median | $96,344 | $81,165 |
| Interquartile 25% (IQ1) | $84,141 | $68,927 |
| Interquartile 75% (IQ3) | $116,507 | $89,553 |
| Interquartile Range (IQR) | $32,365 | $20,626 |
| Standard Deviation (Sample) | $27,353 | $20,387 |
| Standard Deviation (Population) | $27,067 | $20,137 |
Similar Demographics by Median Family Income
Demographics Similar to Bermudans by Median Family Income
In terms of median family income, the demographic groups most similar to Bermudans are Immigrants from Armenia ($97,605, a difference of 0.030%), Nigerian ($97,522, a difference of 0.060%), Panamanian ($97,683, a difference of 0.11%), Immigrants from Bosnia and Herzegovina ($97,432, a difference of 0.15%), and Immigrants from Sudan ($97,737, a difference of 0.16%).
| Demographics | Rating | Rank | Median Family Income |
| Aleuts | 11.6 /100 | #207 | Poor $98,702 |
| Immigrants | Uruguay | 9.2 /100 | #208 | Tragic $98,205 |
| Immigrants | Colombia | 8.7 /100 | #209 | Tragic $98,067 |
| Puget Sound Salish | 8.2 /100 | #210 | Tragic $97,958 |
| Immigrants | Sudan | 7.4 /100 | #211 | Tragic $97,737 |
| Panamanians | 7.2 /100 | #212 | Tragic $97,683 |
| Immigrants | Armenia | 7.0 /100 | #213 | Tragic $97,605 |
| Bermudans | 6.9 /100 | #214 | Tragic $97,577 |
| Nigerians | 6.7 /100 | #215 | Tragic $97,522 |
| Immigrants | Bosnia and Herzegovina | 6.4 /100 | #216 | Tragic $97,432 |
| Japanese | 6.0 /100 | #217 | Tragic $97,288 |
| Immigrants | Cambodia | 5.8 /100 | #218 | Tragic $97,222 |
| Delaware | 5.1 /100 | #219 | Tragic $96,958 |
| Sudanese | 4.7 /100 | #220 | Tragic $96,783 |
| Immigrants | Ghana | 4.2 /100 | #221 | Tragic $96,544 |
Demographics Similar to Osage by Median Family Income
In terms of median family income, the demographic groups most similar to Osage are Cape Verdean ($91,848, a difference of 0.090%), Pennsylvania German ($91,763, a difference of 0.18%), American ($92,096, a difference of 0.19%), Inupiat ($91,730, a difference of 0.21%), and Liberian ($91,722, a difference of 0.22%).
| Demographics | Rating | Rank | Median Family Income |
| Immigrants | Somalia | 0.6 /100 | #251 | Tragic $92,609 |
| Immigrants | El Salvador | 0.6 /100 | #252 | Tragic $92,545 |
| Immigrants | Guyana | 0.6 /100 | #253 | Tragic $92,513 |
| Immigrants | Barbados | 0.5 /100 | #254 | Tragic $92,419 |
| Immigrants | Laos | 0.5 /100 | #255 | Tragic $92,239 |
| Nicaraguans | 0.5 /100 | #256 | Tragic $92,231 |
| Americans | 0.4 /100 | #257 | Tragic $92,096 |
| Osage | 0.4 /100 | #258 | Tragic $91,926 |
| Cape Verdeans | 0.4 /100 | #259 | Tragic $91,848 |
| Pennsylvania Germans | 0.4 /100 | #260 | Tragic $91,763 |
| Inupiat | 0.4 /100 | #261 | Tragic $91,730 |
| Liberians | 0.4 /100 | #262 | Tragic $91,722 |
| Immigrants | West Indies | 0.3 /100 | #263 | Tragic $91,588 |
| Senegalese | 0.3 /100 | #264 | Tragic $91,475 |
| Hmong | 0.3 /100 | #265 | Tragic $91,296 |