Creek vs Austrian Median Female Earnings
COMPARE
Creek
Austrian
Median Female Earnings
Median Female Earnings Comparison
Creek
Austrians
$33,437
MEDIAN FEMALE EARNINGS
0.0/ 100
METRIC RATING
335th/ 347
METRIC RANK
$40,923
MEDIAN FEMALE EARNINGS
92.7/ 100
METRIC RATING
125th/ 347
METRIC RANK
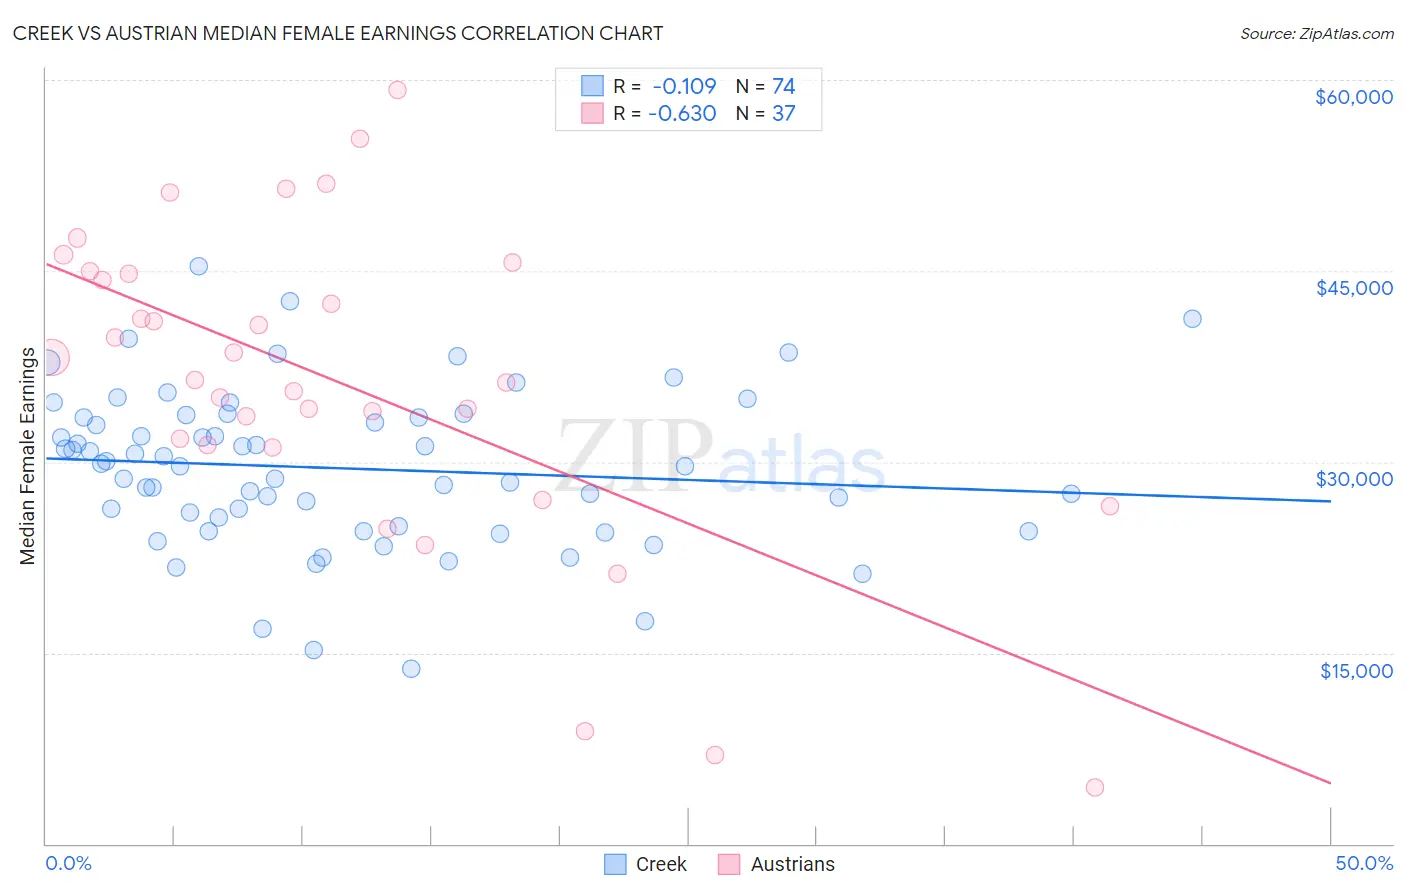
Creek vs Austrian Median Female Earnings Correlation Chart
The statistical analysis conducted on geographies consisting of 178,409,483 people shows a poor negative correlation between the proportion of Creek and median female earnings in the United States with a correlation coefficient (R) of -0.109 and weighted average of $33,437. Similarly, the statistical analysis conducted on geographies consisting of 451,723,547 people shows a significant negative correlation between the proportion of Austrians and median female earnings in the United States with a correlation coefficient (R) of -0.630 and weighted average of $40,923, a difference of 22.4%.
Median Female Earnings Correlation Summary
| Measurement | Creek | Austrian |
| Minimum | $13,750 | $4,400 |
| Maximum | $45,402 | $59,167 |
| Range | $31,652 | $54,767 |
| Mean | $29,490 | $36,245 |
| Median | $29,783 | $36,406 |
| Interquartile 25% (IQ1) | $24,936 | $31,217 |
| Interquartile 75% (IQ3) | $33,500 | $44,864 |
| Interquartile Range (IQR) | $8,564 | $13,647 |
| Standard Deviation (Sample) | $6,205 | $12,547 |
| Standard Deviation (Population) | $6,162 | $12,376 |
Similar Demographics by Median Female Earnings
Demographics Similar to Creek by Median Female Earnings
In terms of median female earnings, the demographic groups most similar to Creek are Ottawa ($33,378, a difference of 0.18%), Yakama ($33,354, a difference of 0.25%), Immigrants from Cuba ($33,291, a difference of 0.44%), Spanish American Indian ($33,625, a difference of 0.56%), and Immigrants from Mexico ($33,236, a difference of 0.61%).
| Demographics | Rating | Rank | Median Female Earnings |
| Immigrants | Central America | 0.0 /100 | #328 | Tragic $33,953 |
| Hopi | 0.0 /100 | #329 | Tragic $33,932 |
| Menominee | 0.0 /100 | #330 | Tragic $33,894 |
| Natives/Alaskans | 0.0 /100 | #331 | Tragic $33,806 |
| Choctaw | 0.0 /100 | #332 | Tragic $33,775 |
| Mexicans | 0.0 /100 | #333 | Tragic $33,664 |
| Spanish American Indians | 0.0 /100 | #334 | Tragic $33,625 |
| Creek | 0.0 /100 | #335 | Tragic $33,437 |
| Ottawa | 0.0 /100 | #336 | Tragic $33,378 |
| Yakama | 0.0 /100 | #337 | Tragic $33,354 |
| Immigrants | Cuba | 0.0 /100 | #338 | Tragic $33,291 |
| Immigrants | Mexico | 0.0 /100 | #339 | Tragic $33,236 |
| Tohono O'odham | 0.0 /100 | #340 | Tragic $33,205 |
| Navajo | 0.0 /100 | #341 | Tragic $33,046 |
| Yup'ik | 0.0 /100 | #342 | Tragic $32,730 |
Demographics Similar to Austrians by Median Female Earnings
In terms of median female earnings, the demographic groups most similar to Austrians are Immigrants from Trinidad and Tobago ($40,895, a difference of 0.070%), Ugandan ($40,889, a difference of 0.080%), Trinidadian and Tobagonian ($40,958, a difference of 0.090%), Guyanese ($40,973, a difference of 0.12%), and Immigrants from Jordan ($40,977, a difference of 0.13%).
| Demographics | Rating | Rank | Median Female Earnings |
| Immigrants | Lebanon | 95.6 /100 | #118 | Exceptional $41,183 |
| Immigrants | Philippines | 95.0 /100 | #119 | Exceptional $41,114 |
| Immigrants | Kuwait | 94.4 /100 | #120 | Exceptional $41,055 |
| Croatians | 93.7 /100 | #121 | Exceptional $40,993 |
| Immigrants | Jordan | 93.5 /100 | #122 | Exceptional $40,977 |
| Guyanese | 93.4 /100 | #123 | Exceptional $40,973 |
| Trinidadians and Tobagonians | 93.2 /100 | #124 | Exceptional $40,958 |
| Austrians | 92.7 /100 | #125 | Exceptional $40,923 |
| Immigrants | Trinidad and Tobago | 92.3 /100 | #126 | Exceptional $40,895 |
| Ugandans | 92.2 /100 | #127 | Exceptional $40,889 |
| Carpatho Rusyns | 91.2 /100 | #128 | Exceptional $40,825 |
| Zimbabweans | 90.8 /100 | #129 | Exceptional $40,798 |
| Immigrants | Guyana | 90.3 /100 | #130 | Exceptional $40,773 |
| Chileans | 90.0 /100 | #131 | Exceptional $40,757 |
| Immigrants | Uganda | 89.7 /100 | #132 | Excellent $40,739 |