Creek vs Cherokee Median Female Earnings
COMPARE
Creek
Cherokee
Median Female Earnings
Median Female Earnings Comparison
Creek
Cherokee
$33,437
MEDIAN FEMALE EARNINGS
0.0/ 100
METRIC RATING
335th/ 347
METRIC RANK
$34,742
MEDIAN FEMALE EARNINGS
0.0/ 100
METRIC RATING
316th/ 347
METRIC RANK
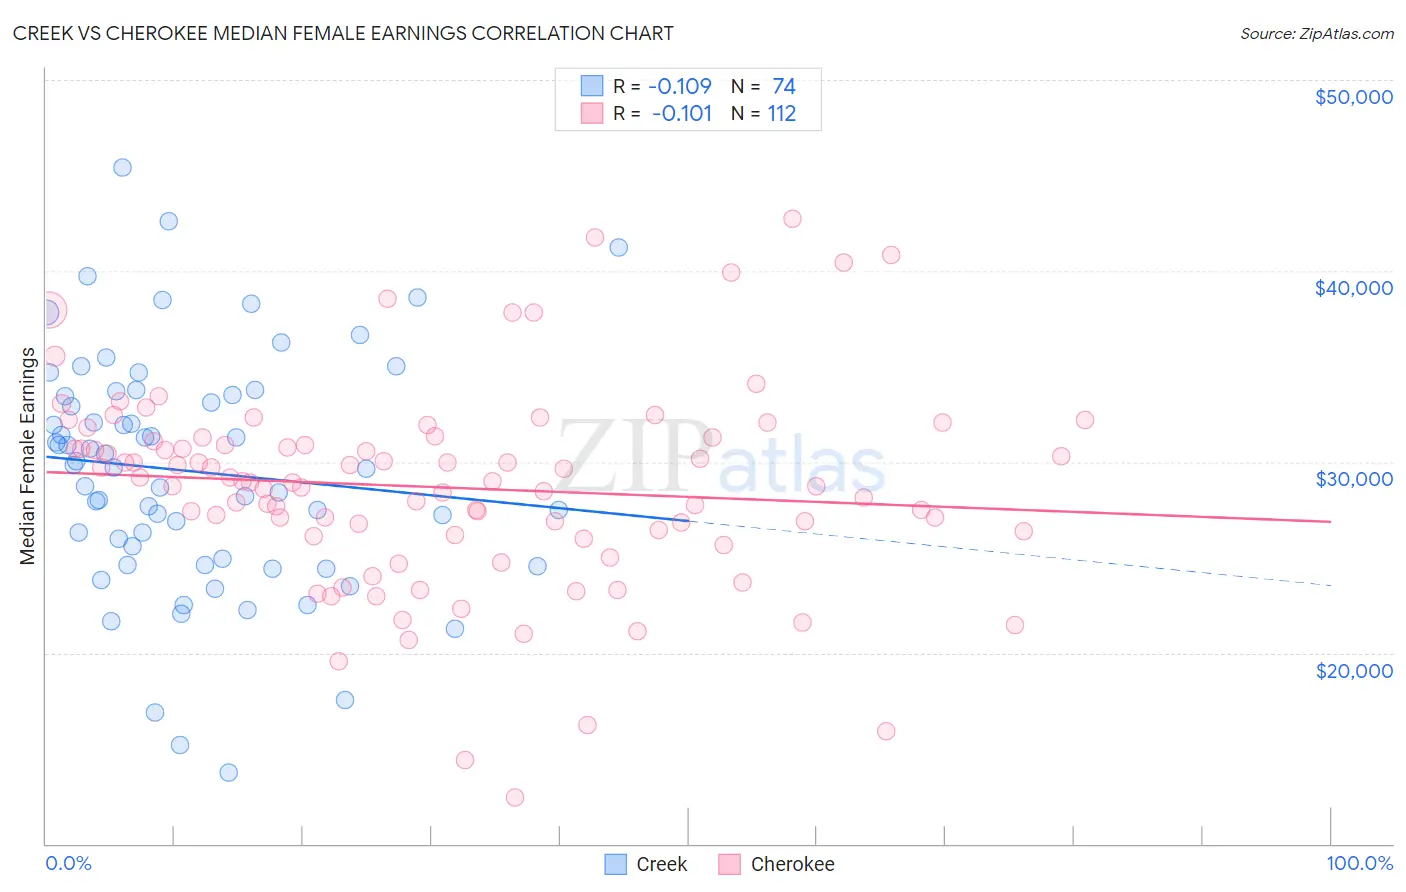
Creek vs Cherokee Median Female Earnings Correlation Chart
The statistical analysis conducted on geographies consisting of 178,409,483 people shows a poor negative correlation between the proportion of Creek and median female earnings in the United States with a correlation coefficient (R) of -0.109 and weighted average of $33,437. Similarly, the statistical analysis conducted on geographies consisting of 492,961,195 people shows a poor negative correlation between the proportion of Cherokee and median female earnings in the United States with a correlation coefficient (R) of -0.101 and weighted average of $34,742, a difference of 3.9%.
Median Female Earnings Correlation Summary
| Measurement | Creek | Cherokee |
| Minimum | $13,750 | $12,396 |
| Maximum | $45,402 | $42,750 |
| Range | $31,652 | $30,354 |
| Mean | $29,490 | $28,662 |
| Median | $29,783 | $28,960 |
| Interquartile 25% (IQ1) | $24,936 | $26,268 |
| Interquartile 75% (IQ3) | $33,500 | $31,156 |
| Interquartile Range (IQR) | $8,564 | $4,888 |
| Standard Deviation (Sample) | $6,205 | $5,298 |
| Standard Deviation (Population) | $6,162 | $5,275 |
Demographics Similar to Creek and Cherokee by Median Female Earnings
In terms of median female earnings, the demographic groups most similar to Creek are Spanish American Indian ($33,625, a difference of 0.56%), Mexican ($33,664, a difference of 0.68%), Choctaw ($33,775, a difference of 1.0%), Native/Alaskan ($33,806, a difference of 1.1%), and Menominee ($33,894, a difference of 1.4%). Similarly, the demographic groups most similar to Cherokee are Potawatomi ($34,739, a difference of 0.010%), Immigrants from Yemen ($34,693, a difference of 0.14%), Pennsylvania German ($34,802, a difference of 0.17%), Shoshone ($34,677, a difference of 0.19%), and Immigrants from Honduras ($34,647, a difference of 0.27%).
| Demographics | Rating | Rank | Median Female Earnings |
| Pennsylvania Germans | 0.0 /100 | #315 | Tragic $34,802 |
| Cherokee | 0.0 /100 | #316 | Tragic $34,742 |
| Potawatomi | 0.0 /100 | #317 | Tragic $34,739 |
| Immigrants | Yemen | 0.0 /100 | #318 | Tragic $34,693 |
| Shoshone | 0.0 /100 | #319 | Tragic $34,677 |
| Immigrants | Honduras | 0.0 /100 | #320 | Tragic $34,647 |
| Hispanics or Latinos | 0.0 /100 | #321 | Tragic $34,421 |
| Chickasaw | 0.0 /100 | #322 | Tragic $34,414 |
| Seminole | 0.0 /100 | #323 | Tragic $34,385 |
| Immigrants | Congo | 0.0 /100 | #324 | Tragic $34,317 |
| Dutch West Indians | 0.0 /100 | #325 | Tragic $34,106 |
| Kiowa | 0.0 /100 | #326 | Tragic $34,074 |
| Cajuns | 0.0 /100 | #327 | Tragic $34,034 |
| Immigrants | Central America | 0.0 /100 | #328 | Tragic $33,953 |
| Hopi | 0.0 /100 | #329 | Tragic $33,932 |
| Menominee | 0.0 /100 | #330 | Tragic $33,894 |
| Natives/Alaskans | 0.0 /100 | #331 | Tragic $33,806 |
| Choctaw | 0.0 /100 | #332 | Tragic $33,775 |
| Mexicans | 0.0 /100 | #333 | Tragic $33,664 |
| Spanish American Indians | 0.0 /100 | #334 | Tragic $33,625 |
| Creek | 0.0 /100 | #335 | Tragic $33,437 |