Immigrants from Ethiopia vs Belgian Householder Income Ages 25 - 44 years
COMPARE
Immigrants from Ethiopia
Belgian
Householder Income Ages 25 - 44 years
Householder Income Ages 25 - 44 years Comparison
Immigrants from Ethiopia
Belgians
$95,256
HOUSEHOLDER INCOME AGES 25 - 44 YEARS
59.5/ 100
METRIC RATING
166th/ 347
METRIC RANK
$94,262
HOUSEHOLDER INCOME AGES 25 - 44 YEARS
45.8/ 100
METRIC RATING
177th/ 347
METRIC RANK
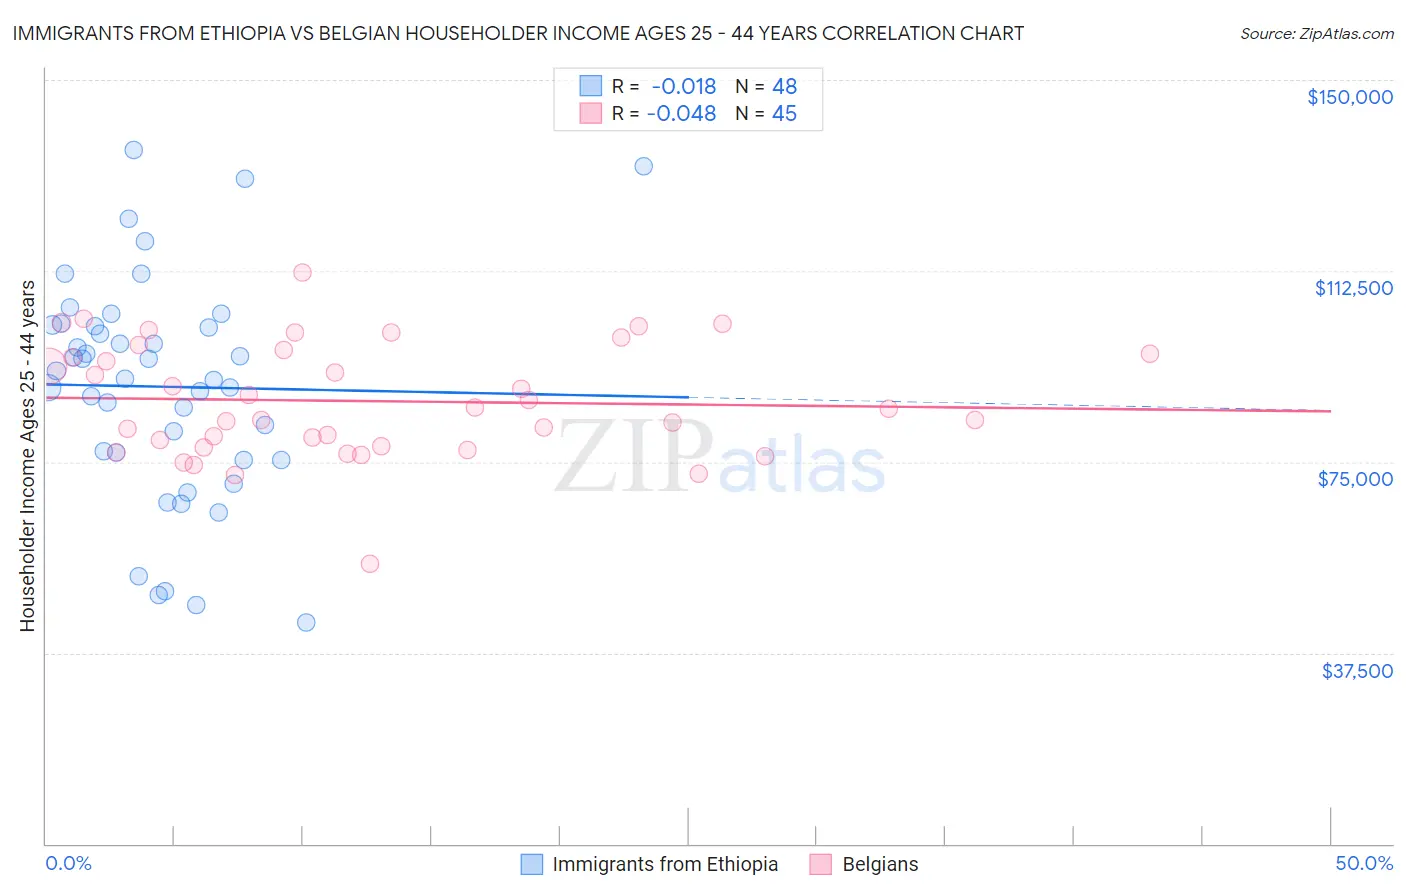
Immigrants from Ethiopia vs Belgian Householder Income Ages 25 - 44 years Correlation Chart
The statistical analysis conducted on geographies consisting of 211,298,235 people shows no correlation between the proportion of Immigrants from Ethiopia and household income with householder between the ages 25 and 44 in the United States with a correlation coefficient (R) of -0.018 and weighted average of $95,256. Similarly, the statistical analysis conducted on geographies consisting of 354,979,371 people shows no correlation between the proportion of Belgians and household income with householder between the ages 25 and 44 in the United States with a correlation coefficient (R) of -0.048 and weighted average of $94,262, a difference of 1.1%.
Householder Income Ages 25 - 44 years Correlation Summary
| Measurement | Immigrants from Ethiopia | Belgian |
| Minimum | $43,552 | $55,000 |
| Maximum | $136,169 | $112,283 |
| Range | $92,617 | $57,283 |
| Mean | $89,756 | $86,931 |
| Median | $92,049 | $85,500 |
| Interquartile 25% (IQ1) | $76,125 | $78,009 |
| Interquartile 75% (IQ3) | $101,763 | $96,571 |
| Interquartile Range (IQR) | $25,638 | $18,562 |
| Standard Deviation (Sample) | $21,797 | $11,310 |
| Standard Deviation (Population) | $21,568 | $11,183 |
Demographics Similar to Immigrants from Ethiopia and Belgians by Householder Income Ages 25 - 44 years
In terms of householder income ages 25 - 44 years, the demographic groups most similar to Immigrants from Ethiopia are Immigrants from Nepal ($95,322, a difference of 0.070%), South American ($95,362, a difference of 0.11%), Immigrants from Saudi Arabia ($95,450, a difference of 0.20%), Czechoslovakian ($95,070, a difference of 0.20%), and Alsatian ($95,059, a difference of 0.21%). Similarly, the demographic groups most similar to Belgians are Immigrants ($94,423, a difference of 0.17%), English ($94,429, a difference of 0.18%), Immigrants from South America ($94,042, a difference of 0.23%), Colombian ($94,565, a difference of 0.32%), and Finnish ($94,610, a difference of 0.37%).
| Demographics | Rating | Rank | Householder Income Ages 25 - 44 years |
| Immigrants | Portugal | 62.8 /100 | #161 | Good $95,512 |
| Swiss | 62.8 /100 | #162 | Good $95,511 |
| Immigrants | Saudi Arabia | 62.0 /100 | #163 | Good $95,450 |
| South Americans | 60.9 /100 | #164 | Good $95,362 |
| Immigrants | Nepal | 60.3 /100 | #165 | Good $95,322 |
| Immigrants | Ethiopia | 59.5 /100 | #166 | Average $95,256 |
| Czechoslovakians | 57.0 /100 | #167 | Average $95,070 |
| Alsatians | 56.8 /100 | #168 | Average $95,059 |
| Native Hawaiians | 56.8 /100 | #169 | Average $95,058 |
| Slovaks | 56.4 /100 | #170 | Average $95,032 |
| Immigrants | Armenia | 54.2 /100 | #171 | Average $94,867 |
| Scottish | 50.8 /100 | #172 | Average $94,622 |
| Finns | 50.6 /100 | #173 | Average $94,610 |
| Colombians | 50.0 /100 | #174 | Average $94,565 |
| English | 48.1 /100 | #175 | Average $94,429 |
| Immigrants | Immigrants | 48.0 /100 | #176 | Average $94,423 |
| Belgians | 45.8 /100 | #177 | Average $94,262 |
| Immigrants | South America | 42.8 /100 | #178 | Average $94,042 |
| French Canadians | 38.2 /100 | #179 | Fair $93,694 |
| French | 37.8 /100 | #180 | Fair $93,665 |
| Puget Sound Salish | 37.7 /100 | #181 | Fair $93,661 |