Cree vs Zimbabwean 8th Grade
COMPARE
Cree
Zimbabwean
8th Grade
8th Grade Comparison
Cree
Zimbabweans
96.4%
8TH GRADE
98.6/ 100
METRIC RATING
99th/ 347
METRIC RANK
96.5%
8TH GRADE
99.4/ 100
METRIC RATING
75th/ 347
METRIC RANK
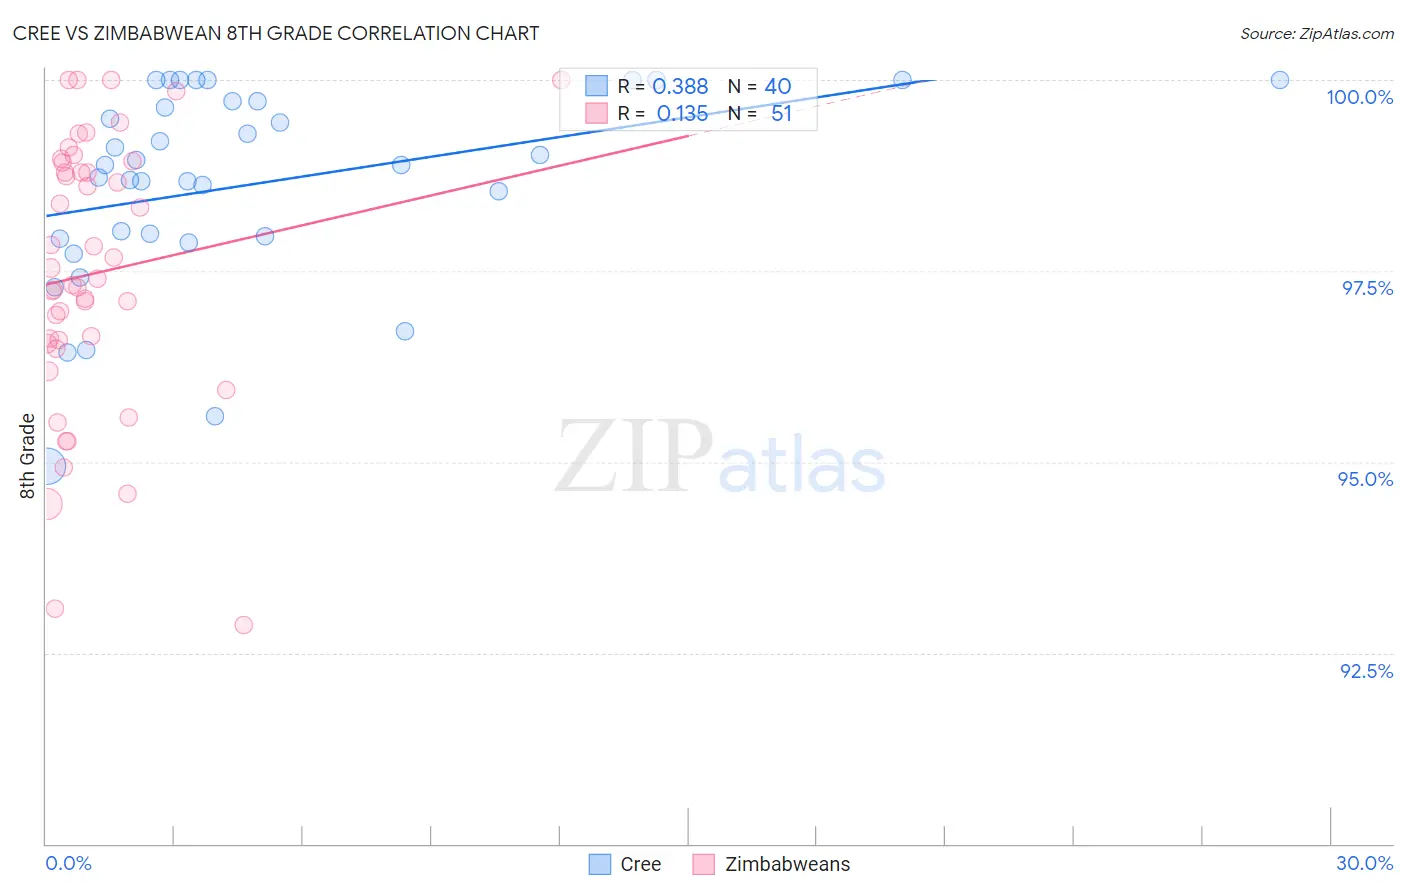
Cree vs Zimbabwean 8th Grade Correlation Chart
The statistical analysis conducted on geographies consisting of 76,204,399 people shows a mild positive correlation between the proportion of Cree and percentage of population with at least 8th grade education in the United States with a correlation coefficient (R) of 0.388 and weighted average of 96.4%. Similarly, the statistical analysis conducted on geographies consisting of 69,203,423 people shows a poor positive correlation between the proportion of Zimbabweans and percentage of population with at least 8th grade education in the United States with a correlation coefficient (R) of 0.135 and weighted average of 96.5%, a difference of 0.14%.
8th Grade Correlation Summary
| Measurement | Cree | Zimbabwean |
| Minimum | 94.9% | 92.9% |
| Maximum | 100.0% | 100.0% |
| Range | 5.1% | 7.1% |
| Mean | 98.6% | 97.5% |
| Median | 98.9% | 97.4% |
| Interquartile 25% (IQ1) | 97.9% | 96.6% |
| Interquartile 75% (IQ3) | 99.7% | 98.9% |
| Interquartile Range (IQR) | 1.8% | 2.4% |
| Standard Deviation (Sample) | 1.3% | 1.8% |
| Standard Deviation (Population) | 1.3% | 1.7% |
Similar Demographics by 8th Grade
Demographics Similar to Cree by 8th Grade
In terms of 8th grade, the demographic groups most similar to Cree are Osage (96.4%, a difference of 0.0%), Immigrants from Germany (96.4%, a difference of 0.0%), Potawatomi (96.4%, a difference of 0.010%), Immigrants from Czechoslovakia (96.4%, a difference of 0.010%), and Immigrants from Singapore (96.4%, a difference of 0.020%).
| Demographics | Rating | Rank | 8th Grade |
| Menominee | 98.9 /100 | #92 | Exceptional 96.4% |
| Immigrants | Denmark | 98.8 /100 | #93 | Exceptional 96.4% |
| Immigrants | Singapore | 98.8 /100 | #94 | Exceptional 96.4% |
| German Russians | 98.8 /100 | #95 | Exceptional 96.4% |
| Potawatomi | 98.7 /100 | #96 | Exceptional 96.4% |
| Osage | 98.7 /100 | #97 | Exceptional 96.4% |
| Immigrants | Germany | 98.7 /100 | #98 | Exceptional 96.4% |
| Cree | 98.6 /100 | #99 | Exceptional 96.4% |
| Immigrants | Czechoslovakia | 98.6 /100 | #100 | Exceptional 96.4% |
| Bhutanese | 98.2 /100 | #101 | Exceptional 96.4% |
| South Africans | 98.2 /100 | #102 | Exceptional 96.4% |
| Immigrants | Saudi Arabia | 98.0 /100 | #103 | Exceptional 96.3% |
| Kiowa | 98.0 /100 | #104 | Exceptional 96.3% |
| Immigrants | North Macedonia | 98.0 /100 | #105 | Exceptional 96.3% |
| Okinawans | 98.0 /100 | #106 | Exceptional 96.3% |
Demographics Similar to Zimbabweans by 8th Grade
In terms of 8th grade, the demographic groups most similar to Zimbabweans are Immigrants from Netherlands (96.5%, a difference of 0.0%), Immigrants from Ireland (96.5%, a difference of 0.010%), Cypriot (96.5%, a difference of 0.010%), Yugoslavian (96.5%, a difference of 0.010%), and New Zealander (96.6%, a difference of 0.020%).
| Demographics | Rating | Rank | 8th Grade |
| Creek | 99.7 /100 | #68 | Exceptional 96.6% |
| Americans | 99.7 /100 | #69 | Exceptional 96.6% |
| Immigrants | Lithuania | 99.6 /100 | #70 | Exceptional 96.6% |
| New Zealanders | 99.5 /100 | #71 | Exceptional 96.6% |
| Immigrants | England | 99.5 /100 | #72 | Exceptional 96.6% |
| Arapaho | 99.5 /100 | #73 | Exceptional 96.6% |
| Immigrants | Ireland | 99.5 /100 | #74 | Exceptional 96.5% |
| Zimbabweans | 99.4 /100 | #75 | Exceptional 96.5% |
| Immigrants | Netherlands | 99.4 /100 | #76 | Exceptional 96.5% |
| Cypriots | 99.4 /100 | #77 | Exceptional 96.5% |
| Yugoslavians | 99.4 /100 | #78 | Exceptional 96.5% |
| Puget Sound Salish | 99.3 /100 | #79 | Exceptional 96.5% |
| Delaware | 99.2 /100 | #80 | Exceptional 96.5% |
| Romanians | 99.2 /100 | #81 | Exceptional 96.5% |
| Turks | 99.2 /100 | #82 | Exceptional 96.5% |