Indonesian vs Zimbabwean Householder Income Ages 45 - 64 years
COMPARE
Indonesian
Zimbabwean
Householder Income Ages 45 - 64 years
Householder Income Ages 45 - 64 years Comparison
Indonesians
Zimbabweans
$84,890
HOUSEHOLDER INCOME AGES 45 - 64 YEARS
0.0/ 100
METRIC RATING
300th/ 347
METRIC RANK
$106,849
HOUSEHOLDER INCOME AGES 45 - 64 YEARS
96.3/ 100
METRIC RATING
108th/ 347
METRIC RANK
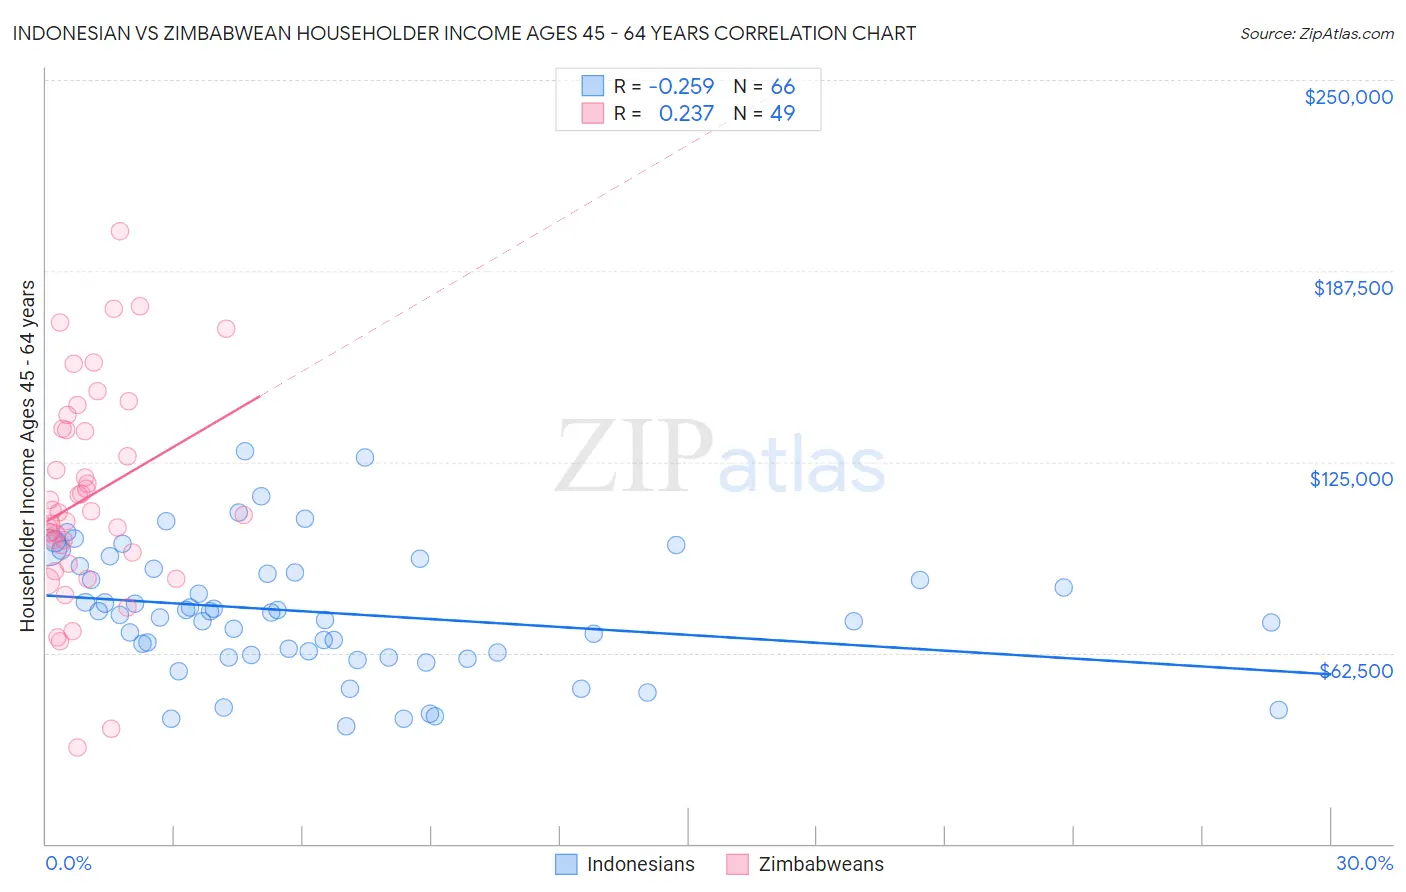
Indonesian vs Zimbabwean Householder Income Ages 45 - 64 years Correlation Chart
The statistical analysis conducted on geographies consisting of 162,545,681 people shows a weak negative correlation between the proportion of Indonesians and household income with householder between the ages 45 and 64 in the United States with a correlation coefficient (R) of -0.259 and weighted average of $84,890. Similarly, the statistical analysis conducted on geographies consisting of 69,179,320 people shows a weak positive correlation between the proportion of Zimbabweans and household income with householder between the ages 45 and 64 in the United States with a correlation coefficient (R) of 0.237 and weighted average of $106,849, a difference of 25.9%.
Householder Income Ages 45 - 64 years Correlation Summary
| Measurement | Indonesian | Zimbabwean |
| Minimum | $38,314 | $31,641 |
| Maximum | $128,309 | $200,450 |
| Range | $89,995 | $168,809 |
| Mean | $75,761 | $113,309 |
| Median | $75,282 | $108,283 |
| Interquartile 25% (IQ1) | $61,778 | $93,481 |
| Interquartile 75% (IQ3) | $90,077 | $135,585 |
| Interquartile Range (IQR) | $28,299 | $42,104 |
| Standard Deviation (Sample) | $20,717 | $34,490 |
| Standard Deviation (Population) | $20,559 | $34,136 |
Similar Demographics by Householder Income Ages 45 - 64 years
Demographics Similar to Indonesians by Householder Income Ages 45 - 64 years
In terms of householder income ages 45 - 64 years, the demographic groups most similar to Indonesians are Immigrants from Mexico ($84,910, a difference of 0.020%), African ($84,925, a difference of 0.040%), Potawatomi ($84,613, a difference of 0.33%), Fijian ($85,187, a difference of 0.35%), and Immigrants from Zaire ($85,207, a difference of 0.37%).
| Demographics | Rating | Rank | Householder Income Ages 45 - 64 years |
| Comanche | 0.1 /100 | #293 | Tragic $85,787 |
| British West Indians | 0.1 /100 | #294 | Tragic $85,571 |
| Immigrants | Grenada | 0.1 /100 | #295 | Tragic $85,552 |
| Immigrants | Zaire | 0.1 /100 | #296 | Tragic $85,207 |
| Fijians | 0.1 /100 | #297 | Tragic $85,187 |
| Africans | 0.0 /100 | #298 | Tragic $84,925 |
| Immigrants | Mexico | 0.0 /100 | #299 | Tragic $84,910 |
| Indonesians | 0.0 /100 | #300 | Tragic $84,890 |
| Potawatomi | 0.0 /100 | #301 | Tragic $84,613 |
| Haitians | 0.0 /100 | #302 | Tragic $84,384 |
| Hondurans | 0.0 /100 | #303 | Tragic $84,079 |
| Ottawa | 0.0 /100 | #304 | Tragic $83,953 |
| Chippewa | 0.0 /100 | #305 | Tragic $83,943 |
| Ute | 0.0 /100 | #306 | Tragic $83,937 |
| Shoshone | 0.0 /100 | #307 | Tragic $83,588 |
Demographics Similar to Zimbabweans by Householder Income Ages 45 - 64 years
In terms of householder income ages 45 - 64 years, the demographic groups most similar to Zimbabweans are Immigrants from Fiji ($106,952, a difference of 0.10%), Armenian ($107,002, a difference of 0.14%), Macedonian ($107,074, a difference of 0.21%), Immigrants from Ukraine ($107,079, a difference of 0.22%), and Chilean ($106,611, a difference of 0.22%).
| Demographics | Rating | Rank | Householder Income Ages 45 - 64 years |
| Immigrants | Kazakhstan | 97.2 /100 | #101 | Exceptional $107,378 |
| Immigrants | Moldova | 97.1 /100 | #102 | Exceptional $107,357 |
| Syrians | 96.9 /100 | #103 | Exceptional $107,207 |
| Immigrants | Ukraine | 96.7 /100 | #104 | Exceptional $107,079 |
| Macedonians | 96.7 /100 | #105 | Exceptional $107,074 |
| Armenians | 96.6 /100 | #106 | Exceptional $107,002 |
| Immigrants | Fiji | 96.5 /100 | #107 | Exceptional $106,952 |
| Zimbabweans | 96.3 /100 | #108 | Exceptional $106,849 |
| Chileans | 95.9 /100 | #109 | Exceptional $106,611 |
| Immigrants | Brazil | 95.6 /100 | #110 | Exceptional $106,470 |
| Immigrants | Vietnam | 95.5 /100 | #111 | Exceptional $106,417 |
| Swedes | 95.4 /100 | #112 | Exceptional $106,377 |
| Europeans | 95.4 /100 | #113 | Exceptional $106,367 |
| Immigrants | Poland | 95.3 /100 | #114 | Exceptional $106,319 |
| Immigrants | Kuwait | 95.2 /100 | #115 | Exceptional $106,285 |