Immigrants from Hong Kong vs Immigrants from Western Asia Median Earnings
COMPARE
Immigrants from Hong Kong
Immigrants from Western Asia
Median Earnings
Median Earnings Comparison
Immigrants from Hong Kong
Immigrants from Western Asia
$59,433
MEDIAN EARNINGS
100.0/ 100
METRIC RATING
4th/ 347
METRIC RANK
$49,389
MEDIAN EARNINGS
98.4/ 100
METRIC RATING
105th/ 347
METRIC RANK
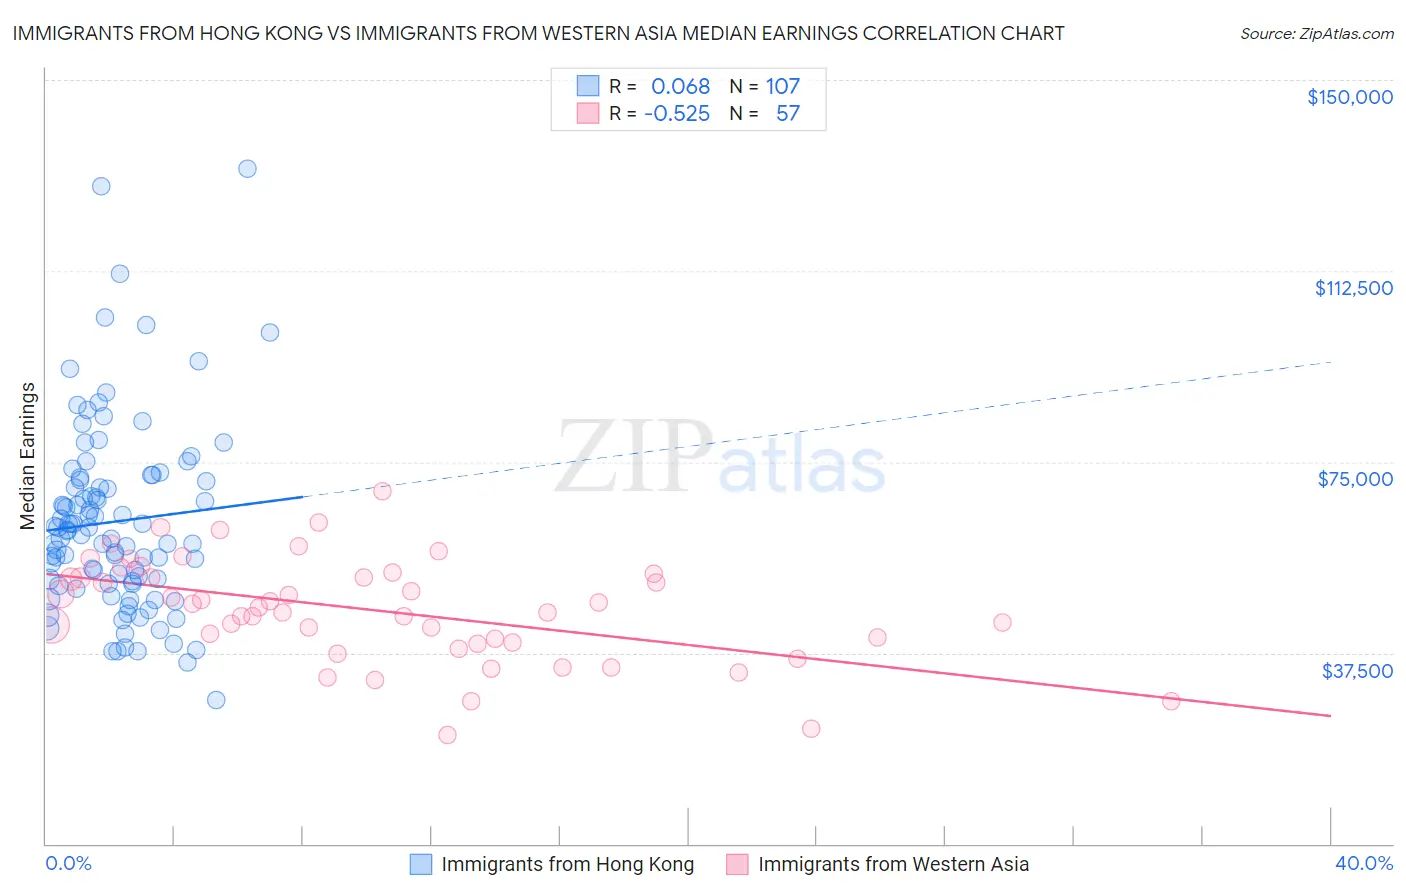
Immigrants from Hong Kong vs Immigrants from Western Asia Median Earnings Correlation Chart
The statistical analysis conducted on geographies consisting of 253,960,155 people shows a slight positive correlation between the proportion of Immigrants from Hong Kong and median earnings in the United States with a correlation coefficient (R) of 0.068 and weighted average of $59,433. Similarly, the statistical analysis conducted on geographies consisting of 404,426,866 people shows a substantial negative correlation between the proportion of Immigrants from Western Asia and median earnings in the United States with a correlation coefficient (R) of -0.525 and weighted average of $49,389, a difference of 20.3%.
Median Earnings Correlation Summary
| Measurement | Immigrants from Hong Kong | Immigrants from Western Asia |
| Minimum | $28,125 | $21,250 |
| Maximum | $132,614 | $69,348 |
| Range | $104,489 | $48,098 |
| Mean | $63,267 | $45,817 |
| Median | $61,404 | $46,307 |
| Interquartile 25% (IQ1) | $51,159 | $39,374 |
| Interquartile 75% (IQ3) | $71,509 | $52,673 |
| Interquartile Range (IQR) | $20,350 | $13,299 |
| Standard Deviation (Sample) | $18,453 | $10,167 |
| Standard Deviation (Population) | $18,367 | $10,077 |
Similar Demographics by Median Earnings
Demographics Similar to Immigrants from Hong Kong by Median Earnings
In terms of median earnings, the demographic groups most similar to Immigrants from Hong Kong are Thai ($59,237, a difference of 0.33%), Immigrants from Singapore ($59,038, a difference of 0.67%), Iranian ($58,474, a difference of 1.6%), Immigrants from India ($60,648, a difference of 2.0%), and Immigrants from Taiwan ($61,151, a difference of 2.9%).
| Demographics | Rating | Rank | Median Earnings |
| Filipinos | 100.0 /100 | #1 | Exceptional $61,197 |
| Immigrants | Taiwan | 100.0 /100 | #2 | Exceptional $61,151 |
| Immigrants | India | 100.0 /100 | #3 | Exceptional $60,648 |
| Immigrants | Hong Kong | 100.0 /100 | #4 | Exceptional $59,433 |
| Thais | 100.0 /100 | #5 | Exceptional $59,237 |
| Immigrants | Singapore | 100.0 /100 | #6 | Exceptional $59,038 |
| Iranians | 100.0 /100 | #7 | Exceptional $58,474 |
| Immigrants | Iran | 100.0 /100 | #8 | Exceptional $57,612 |
| Okinawans | 100.0 /100 | #9 | Exceptional $57,550 |
| Immigrants | South Central Asia | 100.0 /100 | #10 | Exceptional $57,114 |
| Immigrants | Israel | 100.0 /100 | #11 | Exceptional $57,034 |
| Immigrants | Ireland | 100.0 /100 | #12 | Exceptional $56,854 |
| Immigrants | China | 100.0 /100 | #13 | Exceptional $56,638 |
| Immigrants | Australia | 100.0 /100 | #14 | Exceptional $56,305 |
| Indians (Asian) | 100.0 /100 | #15 | Exceptional $56,253 |
Demographics Similar to Immigrants from Western Asia by Median Earnings
In terms of median earnings, the demographic groups most similar to Immigrants from Western Asia are Immigrants from Albania ($49,377, a difference of 0.020%), Immigrants from Morocco ($49,368, a difference of 0.040%), Immigrants from Brazil ($49,463, a difference of 0.15%), Austrian ($49,501, a difference of 0.23%), and Ethiopian ($49,572, a difference of 0.37%).
| Demographics | Rating | Rank | Median Earnings |
| Immigrants | Northern Africa | 98.9 /100 | #98 | Exceptional $49,648 |
| Immigrants | Afghanistan | 98.9 /100 | #99 | Exceptional $49,645 |
| Immigrants | Poland | 98.9 /100 | #100 | Exceptional $49,633 |
| Jordanians | 98.9 /100 | #101 | Exceptional $49,632 |
| Ethiopians | 98.8 /100 | #102 | Exceptional $49,572 |
| Austrians | 98.7 /100 | #103 | Exceptional $49,501 |
| Immigrants | Brazil | 98.6 /100 | #104 | Exceptional $49,463 |
| Immigrants | Western Asia | 98.4 /100 | #105 | Exceptional $49,389 |
| Immigrants | Albania | 98.4 /100 | #106 | Exceptional $49,377 |
| Immigrants | Morocco | 98.4 /100 | #107 | Exceptional $49,368 |
| Palestinians | 98.0 /100 | #108 | Exceptional $49,209 |
| Syrians | 97.1 /100 | #109 | Exceptional $48,934 |
| Immigrants | Ethiopia | 97.1 /100 | #110 | Exceptional $48,924 |
| Immigrants | Zimbabwe | 97.0 /100 | #111 | Exceptional $48,913 |
| Northern Europeans | 96.9 /100 | #112 | Exceptional $48,887 |