Cree vs Immigrants from Western Asia Unemployment Among Ages 30 to 34 years
COMPARE
Cree
Immigrants from Western Asia
Unemployment Among Ages 30 to 34 years
Unemployment Among Ages 30 to 34 years Comparison
Cree
Immigrants from Western Asia
6.4%
UNEMPLOYMENT AMONG AGES 30 TO 34 YEARS
0.0/ 100
METRIC RATING
279th/ 347
METRIC RANK
5.5%
UNEMPLOYMENT AMONG AGES 30 TO 34 YEARS
38.2/ 100
METRIC RATING
187th/ 347
METRIC RANK
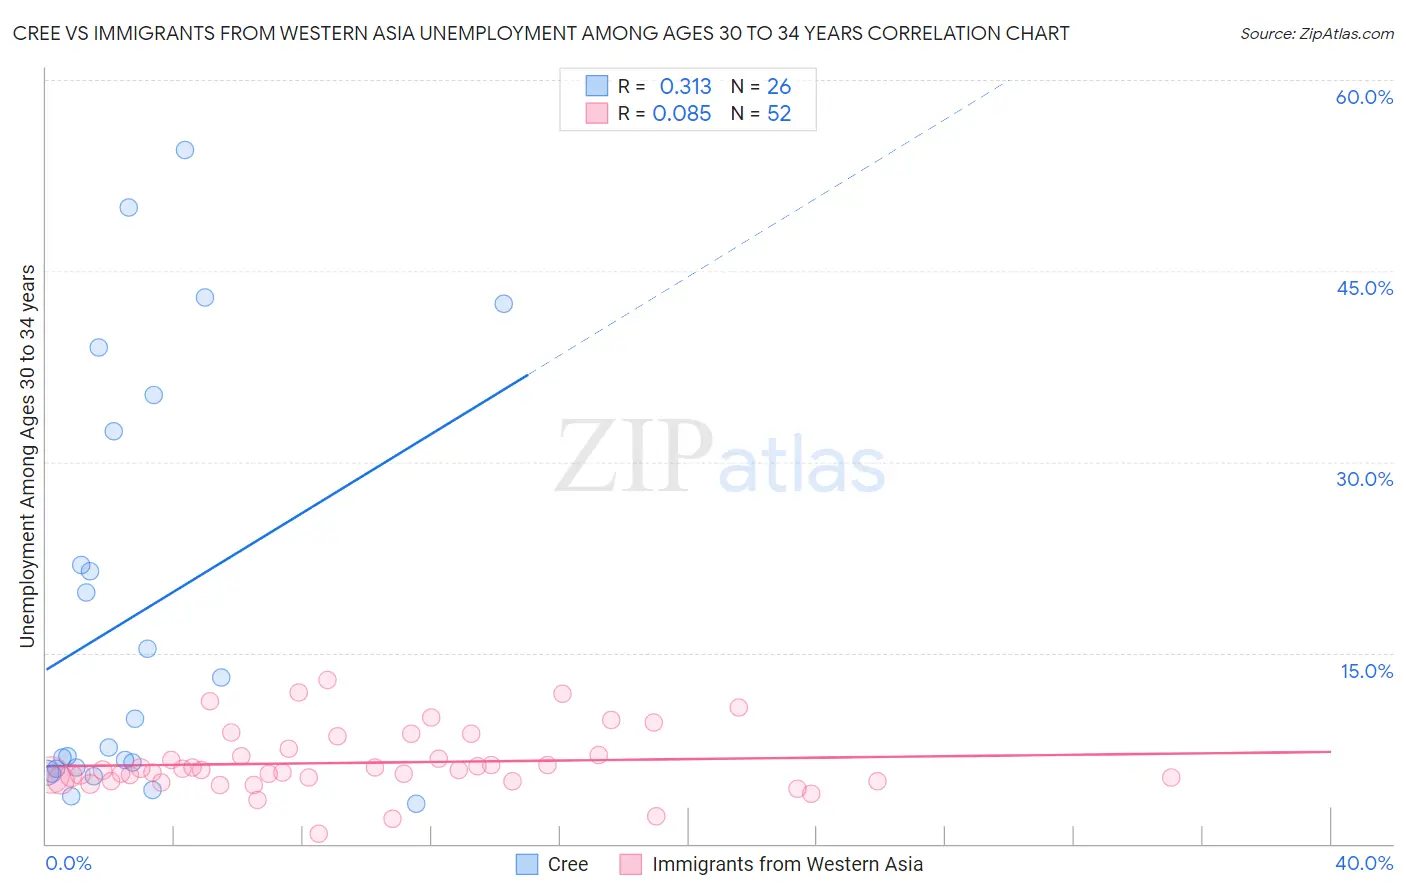
Cree vs Immigrants from Western Asia Unemployment Among Ages 30 to 34 years Correlation Chart
The statistical analysis conducted on geographies consisting of 74,890,168 people shows a mild positive correlation between the proportion of Cree and unemployment rate among population between the ages 30 and 34 in the United States with a correlation coefficient (R) of 0.313 and weighted average of 6.4%. Similarly, the statistical analysis conducted on geographies consisting of 381,868,391 people shows a slight positive correlation between the proportion of Immigrants from Western Asia and unemployment rate among population between the ages 30 and 34 in the United States with a correlation coefficient (R) of 0.085 and weighted average of 5.5%, a difference of 15.6%.
Unemployment Among Ages 30 to 34 years Correlation Summary
| Measurement | Cree | Immigrants from Western Asia |
| Minimum | 3.1% | 0.80% |
| Maximum | 54.5% | 12.9% |
| Range | 51.4% | 12.1% |
| Mean | 18.1% | 6.4% |
| Median | 8.7% | 5.8% |
| Interquartile 25% (IQ1) | 5.9% | 4.9% |
| Interquartile 75% (IQ3) | 32.4% | 7.2% |
| Interquartile Range (IQR) | 26.5% | 2.3% |
| Standard Deviation (Sample) | 16.3% | 2.5% |
| Standard Deviation (Population) | 16.0% | 2.5% |
Similar Demographics by Unemployment Among Ages 30 to 34 years
Demographics Similar to Cree by Unemployment Among Ages 30 to 34 years
In terms of unemployment among ages 30 to 34 years, the demographic groups most similar to Cree are Cherokee (6.4%, a difference of 0.040%), Immigrants from Caribbean (6.4%, a difference of 0.37%), Osage (6.3%, a difference of 0.48%), Immigrants from Ecuador (6.3%, a difference of 0.56%), and African (6.4%, a difference of 0.74%).
| Demographics | Rating | Rank | Unemployment Among Ages 30 to 34 years |
| Blackfeet | 0.0 /100 | #272 | Tragic 6.3% |
| Ottawa | 0.0 /100 | #273 | Tragic 6.3% |
| U.S. Virgin Islanders | 0.0 /100 | #274 | Tragic 6.3% |
| Ecuadorians | 0.0 /100 | #275 | Tragic 6.3% |
| Pennsylvania Germans | 0.0 /100 | #276 | Tragic 6.3% |
| Immigrants | Ecuador | 0.0 /100 | #277 | Tragic 6.3% |
| Osage | 0.0 /100 | #278 | Tragic 6.3% |
| Cree | 0.0 /100 | #279 | Tragic 6.4% |
| Cherokee | 0.0 /100 | #280 | Tragic 6.4% |
| Immigrants | Caribbean | 0.0 /100 | #281 | Tragic 6.4% |
| Africans | 0.0 /100 | #282 | Tragic 6.4% |
| Hispanics or Latinos | 0.0 /100 | #283 | Tragic 6.4% |
| Immigrants | Bangladesh | 0.0 /100 | #284 | Tragic 6.4% |
| Choctaw | 0.0 /100 | #285 | Tragic 6.4% |
| Central American Indians | 0.0 /100 | #286 | Tragic 6.4% |
Demographics Similar to Immigrants from Western Asia by Unemployment Among Ages 30 to 34 years
In terms of unemployment among ages 30 to 34 years, the demographic groups most similar to Immigrants from Western Asia are Canadian (5.5%, a difference of 0.0%), Immigrants from Western Europe (5.5%, a difference of 0.070%), Immigrants from Norway (5.5%, a difference of 0.16%), Immigrants from England (5.5%, a difference of 0.19%), and Malaysian (5.5%, a difference of 0.26%).
| Demographics | Rating | Rank | Unemployment Among Ages 30 to 34 years |
| Italians | 45.5 /100 | #180 | Average 5.5% |
| Immigrants | Lebanon | 43.5 /100 | #181 | Average 5.5% |
| Immigrants | Denmark | 43.4 /100 | #182 | Average 5.5% |
| Hungarians | 43.1 /100 | #183 | Average 5.5% |
| Malaysians | 41.8 /100 | #184 | Average 5.5% |
| Immigrants | Western Europe | 39.1 /100 | #185 | Fair 5.5% |
| Canadians | 38.2 /100 | #186 | Fair 5.5% |
| Immigrants | Western Asia | 38.2 /100 | #187 | Fair 5.5% |
| Immigrants | Norway | 36.1 /100 | #188 | Fair 5.5% |
| Immigrants | England | 35.7 /100 | #189 | Fair 5.5% |
| Immigrants | Kazakhstan | 33.9 /100 | #190 | Fair 5.5% |
| Irish | 31.3 /100 | #191 | Fair 5.5% |
| Moroccans | 31.2 /100 | #192 | Fair 5.5% |
| Immigrants | Africa | 31.0 /100 | #193 | Fair 5.5% |
| Slavs | 30.9 /100 | #194 | Fair 5.5% |