Immigrants from Lithuania vs Immigrants from Portugal Householder Income Ages 45 - 64 years
COMPARE
Immigrants from Lithuania
Immigrants from Portugal
Householder Income Ages 45 - 64 years
Householder Income Ages 45 - 64 years Comparison
Immigrants from Lithuania
Immigrants from Portugal
$114,336
HOUSEHOLDER INCOME AGES 45 - 64 YEARS
99.9/ 100
METRIC RATING
41st/ 347
METRIC RANK
$99,203
HOUSEHOLDER INCOME AGES 45 - 64 YEARS
36.3/ 100
METRIC RATING
188th/ 347
METRIC RANK
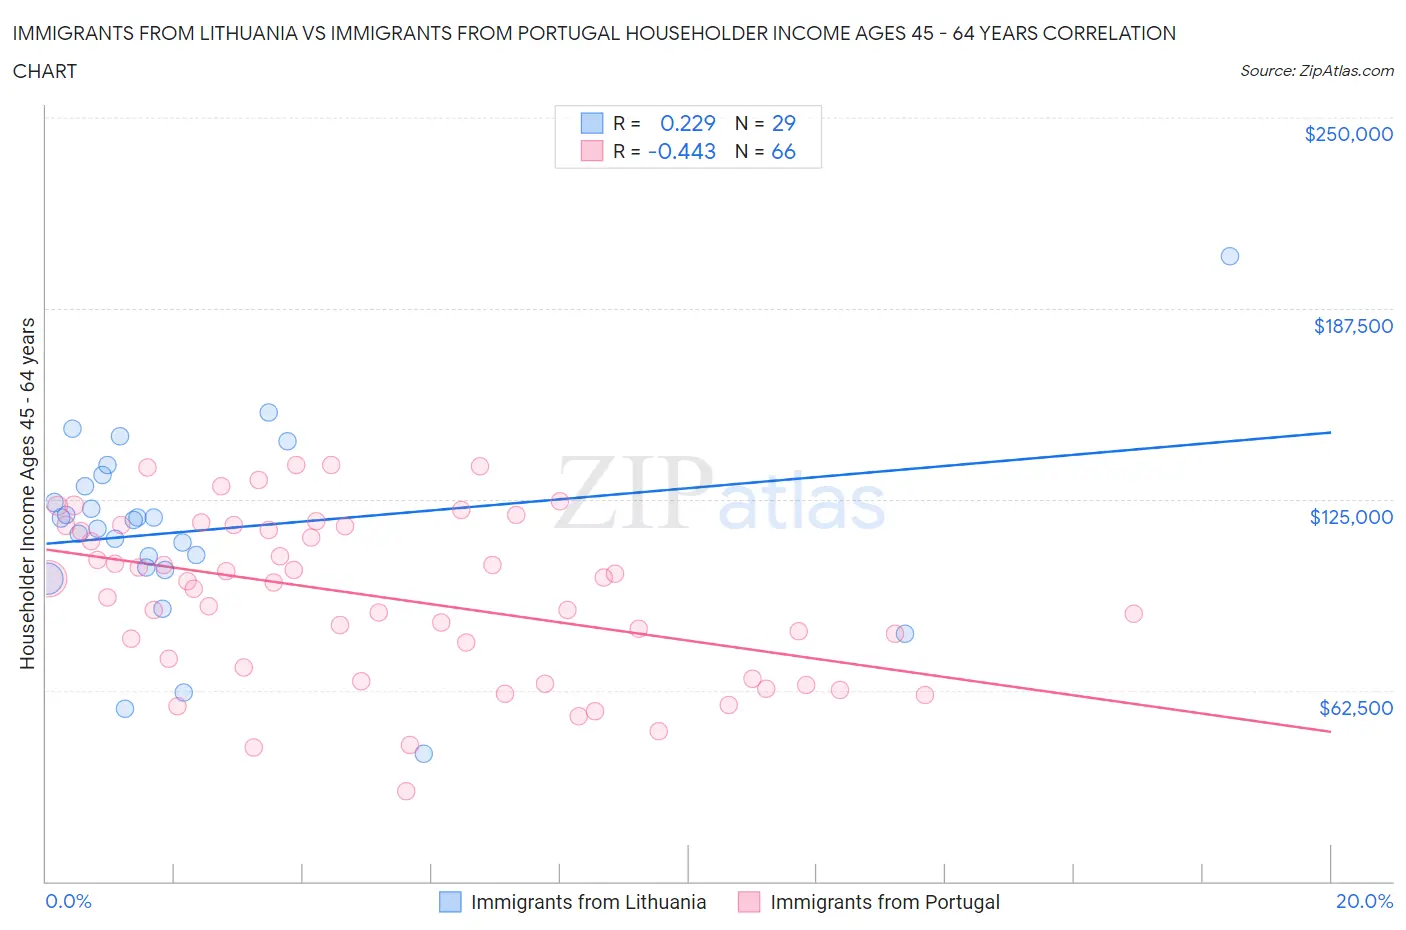
Immigrants from Lithuania vs Immigrants from Portugal Householder Income Ages 45 - 64 years Correlation Chart
The statistical analysis conducted on geographies consisting of 117,696,258 people shows a weak positive correlation between the proportion of Immigrants from Lithuania and household income with householder between the ages 45 and 64 in the United States with a correlation coefficient (R) of 0.229 and weighted average of $114,336. Similarly, the statistical analysis conducted on geographies consisting of 174,709,169 people shows a moderate negative correlation between the proportion of Immigrants from Portugal and household income with householder between the ages 45 and 64 in the United States with a correlation coefficient (R) of -0.443 and weighted average of $99,203, a difference of 15.2%.
Householder Income Ages 45 - 64 years Correlation Summary
| Measurement | Immigrants from Lithuania | Immigrants from Portugal |
| Minimum | $41,667 | $29,554 |
| Maximum | $204,500 | $136,394 |
| Range | $162,833 | $106,840 |
| Mean | $114,986 | $93,039 |
| Median | $118,271 | $97,899 |
| Interquartile 25% (IQ1) | $102,220 | $70,027 |
| Interquartile 75% (IQ3) | $131,130 | $116,103 |
| Interquartile Range (IQR) | $28,910 | $46,076 |
| Standard Deviation (Sample) | $31,501 | $26,518 |
| Standard Deviation (Population) | $30,953 | $26,316 |
Similar Demographics by Householder Income Ages 45 - 64 years
Demographics Similar to Immigrants from Lithuania by Householder Income Ages 45 - 64 years
In terms of householder income ages 45 - 64 years, the demographic groups most similar to Immigrants from Lithuania are Cambodian ($114,342, a difference of 0.010%), Immigrants from Turkey ($114,407, a difference of 0.060%), Immigrants from Pakistan ($114,434, a difference of 0.090%), Estonian ($114,220, a difference of 0.10%), and Israeli ($114,186, a difference of 0.13%).
| Demographics | Rating | Rank | Householder Income Ages 45 - 64 years |
| Immigrants | Denmark | 100.0 /100 | #34 | Exceptional $116,000 |
| Latvians | 100.0 /100 | #35 | Exceptional $115,957 |
| Immigrants | Switzerland | 100.0 /100 | #36 | Exceptional $115,934 |
| Maltese | 99.9 /100 | #37 | Exceptional $114,754 |
| Immigrants | Pakistan | 99.9 /100 | #38 | Exceptional $114,434 |
| Immigrants | Turkey | 99.9 /100 | #39 | Exceptional $114,407 |
| Cambodians | 99.9 /100 | #40 | Exceptional $114,342 |
| Immigrants | Lithuania | 99.9 /100 | #41 | Exceptional $114,336 |
| Estonians | 99.9 /100 | #42 | Exceptional $114,220 |
| Israelis | 99.9 /100 | #43 | Exceptional $114,186 |
| Bulgarians | 99.9 /100 | #44 | Exceptional $113,883 |
| Immigrants | France | 99.9 /100 | #45 | Exceptional $113,680 |
| Immigrants | Greece | 99.9 /100 | #46 | Exceptional $113,548 |
| Australians | 99.9 /100 | #47 | Exceptional $113,533 |
| Immigrants | Indonesia | 99.9 /100 | #48 | Exceptional $113,519 |
Demographics Similar to Immigrants from Portugal by Householder Income Ages 45 - 64 years
In terms of householder income ages 45 - 64 years, the demographic groups most similar to Immigrants from Portugal are Immigrants from South America ($99,126, a difference of 0.080%), French Canadian ($99,093, a difference of 0.11%), Iraqi ($99,387, a difference of 0.19%), Kenyan ($98,970, a difference of 0.24%), and Celtic ($98,896, a difference of 0.31%).
| Demographics | Rating | Rank | Householder Income Ages 45 - 64 years |
| Immigrants | Immigrants | 45.3 /100 | #181 | Average $99,943 |
| Finns | 44.8 /100 | #182 | Average $99,904 |
| Spaniards | 44.6 /100 | #183 | Average $99,889 |
| French | 43.8 /100 | #184 | Average $99,824 |
| Colombians | 43.2 /100 | #185 | Average $99,772 |
| Dutch | 41.7 /100 | #186 | Average $99,650 |
| Iraqis | 38.5 /100 | #187 | Fair $99,387 |
| Immigrants | Portugal | 36.3 /100 | #188 | Fair $99,203 |
| Immigrants | South America | 35.4 /100 | #189 | Fair $99,126 |
| French Canadians | 35.1 /100 | #190 | Fair $99,093 |
| Kenyans | 33.7 /100 | #191 | Fair $98,970 |
| Celtics | 32.9 /100 | #192 | Fair $98,896 |
| Hawaiians | 31.6 /100 | #193 | Fair $98,778 |
| Uruguayans | 30.3 /100 | #194 | Fair $98,660 |
| Spanish | 29.2 /100 | #195 | Fair $98,554 |