New Zealander vs Immigrants from Portugal Householder Income Ages 45 - 64 years
COMPARE
New Zealander
Immigrants from Portugal
Householder Income Ages 45 - 64 years
Householder Income Ages 45 - 64 years Comparison
New Zealanders
Immigrants from Portugal
$111,286
HOUSEHOLDER INCOME AGES 45 - 64 YEARS
99.6/ 100
METRIC RATING
66th/ 347
METRIC RANK
$99,203
HOUSEHOLDER INCOME AGES 45 - 64 YEARS
36.3/ 100
METRIC RATING
188th/ 347
METRIC RANK
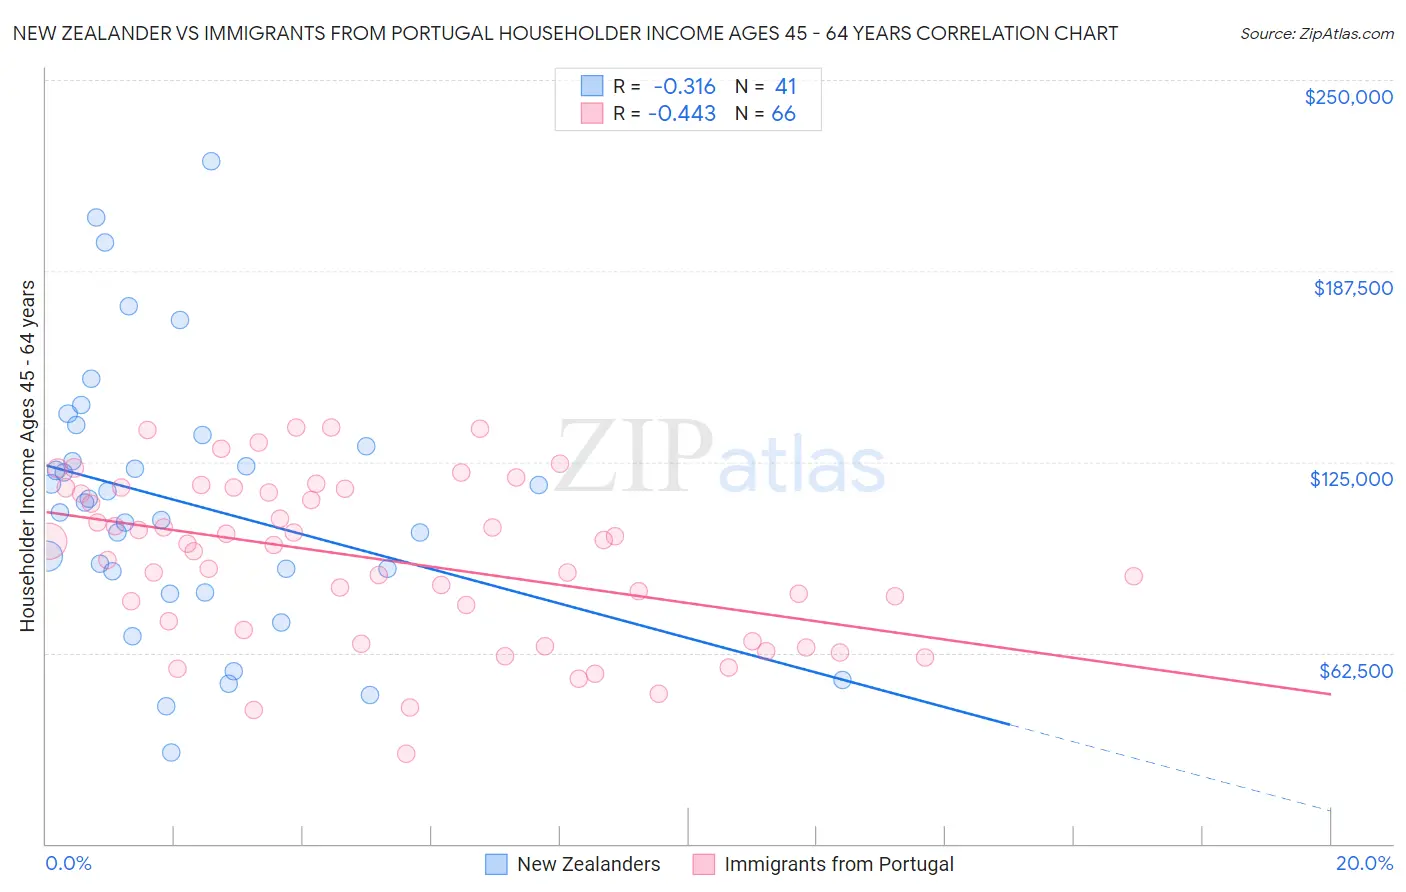
New Zealander vs Immigrants from Portugal Householder Income Ages 45 - 64 years Correlation Chart
The statistical analysis conducted on geographies consisting of 106,839,275 people shows a mild negative correlation between the proportion of New Zealanders and household income with householder between the ages 45 and 64 in the United States with a correlation coefficient (R) of -0.316 and weighted average of $111,286. Similarly, the statistical analysis conducted on geographies consisting of 174,709,169 people shows a moderate negative correlation between the proportion of Immigrants from Portugal and household income with householder between the ages 45 and 64 in the United States with a correlation coefficient (R) of -0.443 and weighted average of $99,203, a difference of 12.2%.
Householder Income Ages 45 - 64 years Correlation Summary
| Measurement | New Zealander | Immigrants from Portugal |
| Minimum | $29,688 | $29,554 |
| Maximum | $223,409 | $136,394 |
| Range | $193,721 | $106,840 |
| Mean | $111,423 | $93,039 |
| Median | $111,501 | $97,899 |
| Interquartile 25% (IQ1) | $85,594 | $70,027 |
| Interquartile 75% (IQ3) | $131,875 | $116,103 |
| Interquartile Range (IQR) | $46,281 | $46,076 |
| Standard Deviation (Sample) | $43,171 | $26,518 |
| Standard Deviation (Population) | $42,642 | $26,316 |
Similar Demographics by Householder Income Ages 45 - 64 years
Demographics Similar to New Zealanders by Householder Income Ages 45 - 64 years
In terms of householder income ages 45 - 64 years, the demographic groups most similar to New Zealanders are Immigrants from Belarus ($111,430, a difference of 0.13%), Immigrants from Latvia ($111,454, a difference of 0.15%), Laotian ($111,051, a difference of 0.21%), Mongolian ($111,602, a difference of 0.28%), and Immigrants from Norway ($111,669, a difference of 0.34%).
| Demographics | Rating | Rank | Householder Income Ages 45 - 64 years |
| Immigrants | Europe | 99.7 /100 | #59 | Exceptional $111,984 |
| Immigrants | Netherlands | 99.7 /100 | #60 | Exceptional $111,982 |
| Immigrants | Czechoslovakia | 99.7 /100 | #61 | Exceptional $111,914 |
| Immigrants | Norway | 99.7 /100 | #62 | Exceptional $111,669 |
| Mongolians | 99.6 /100 | #63 | Exceptional $111,602 |
| Immigrants | Latvia | 99.6 /100 | #64 | Exceptional $111,454 |
| Immigrants | Belarus | 99.6 /100 | #65 | Exceptional $111,430 |
| New Zealanders | 99.6 /100 | #66 | Exceptional $111,286 |
| Laotians | 99.5 /100 | #67 | Exceptional $111,051 |
| Immigrants | Romania | 99.4 /100 | #68 | Exceptional $110,633 |
| Immigrants | Italy | 99.4 /100 | #69 | Exceptional $110,434 |
| Koreans | 99.3 /100 | #70 | Exceptional $110,334 |
| Italians | 99.3 /100 | #71 | Exceptional $110,224 |
| Assyrians/Chaldeans/Syriacs | 99.3 /100 | #72 | Exceptional $110,201 |
| Argentineans | 99.3 /100 | #73 | Exceptional $110,103 |
Demographics Similar to Immigrants from Portugal by Householder Income Ages 45 - 64 years
In terms of householder income ages 45 - 64 years, the demographic groups most similar to Immigrants from Portugal are Immigrants from South America ($99,126, a difference of 0.080%), French Canadian ($99,093, a difference of 0.11%), Iraqi ($99,387, a difference of 0.19%), Kenyan ($98,970, a difference of 0.24%), and Celtic ($98,896, a difference of 0.31%).
| Demographics | Rating | Rank | Householder Income Ages 45 - 64 years |
| Immigrants | Immigrants | 45.3 /100 | #181 | Average $99,943 |
| Finns | 44.8 /100 | #182 | Average $99,904 |
| Spaniards | 44.6 /100 | #183 | Average $99,889 |
| French | 43.8 /100 | #184 | Average $99,824 |
| Colombians | 43.2 /100 | #185 | Average $99,772 |
| Dutch | 41.7 /100 | #186 | Average $99,650 |
| Iraqis | 38.5 /100 | #187 | Fair $99,387 |
| Immigrants | Portugal | 36.3 /100 | #188 | Fair $99,203 |
| Immigrants | South America | 35.4 /100 | #189 | Fair $99,126 |
| French Canadians | 35.1 /100 | #190 | Fair $99,093 |
| Kenyans | 33.7 /100 | #191 | Fair $98,970 |
| Celtics | 32.9 /100 | #192 | Fair $98,896 |
| Hawaiians | 31.6 /100 | #193 | Fair $98,778 |
| Uruguayans | 30.3 /100 | #194 | Fair $98,660 |
| Spanish | 29.2 /100 | #195 | Fair $98,554 |