Basque vs Bermudan Median Family Income
COMPARE
Basque
Bermudan
Median Family Income
Median Family Income Comparison
Basques
Bermudans
$104,760
MEDIAN FAMILY INCOME
74.4/ 100
METRIC RATING
156th/ 347
METRIC RANK
$97,577
MEDIAN FAMILY INCOME
6.9/ 100
METRIC RATING
214th/ 347
METRIC RANK
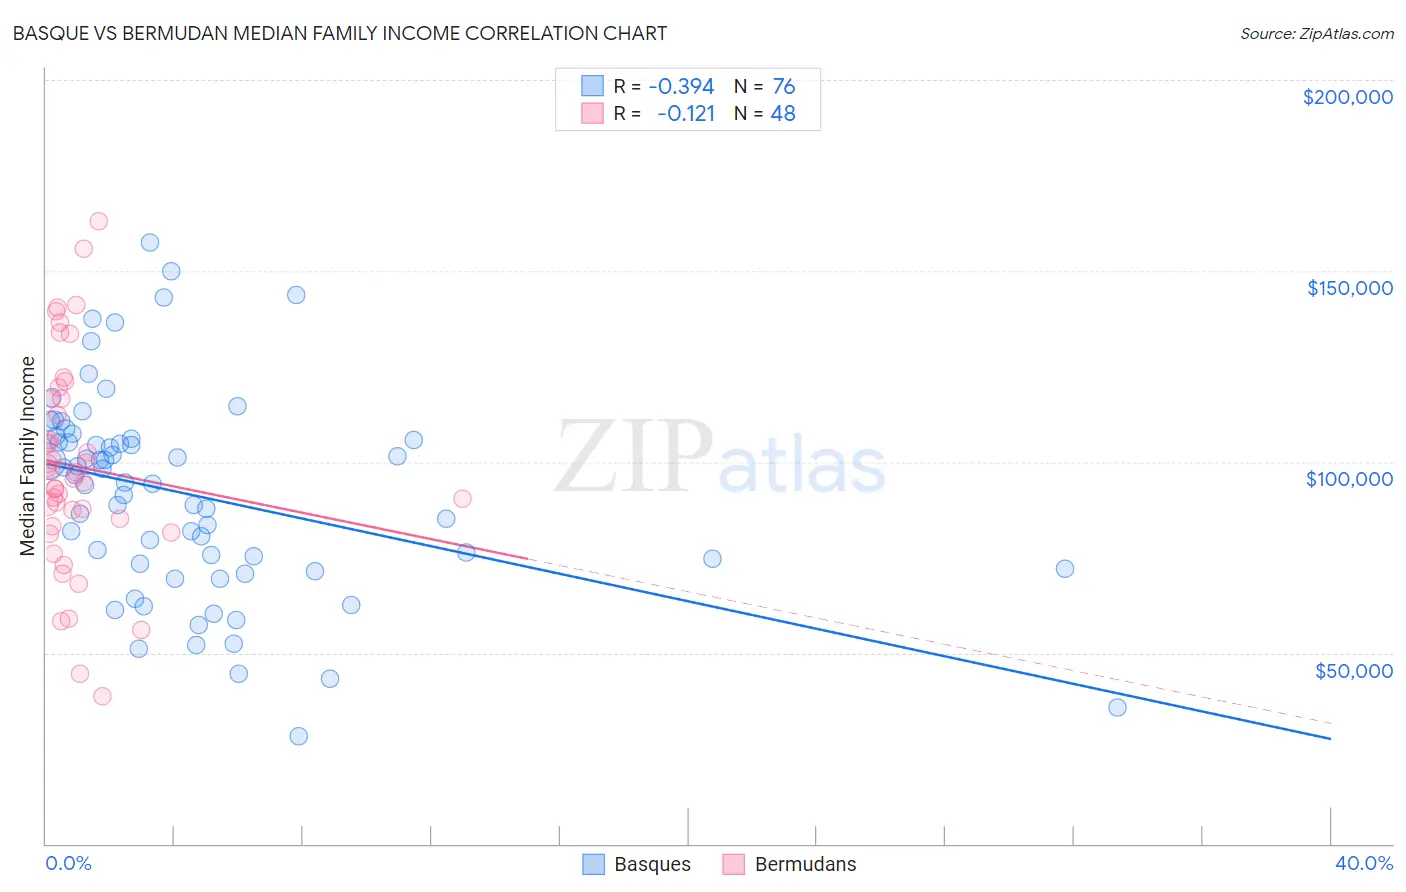
Basque vs Bermudan Median Family Income Correlation Chart
The statistical analysis conducted on geographies consisting of 165,742,125 people shows a mild negative correlation between the proportion of Basques and median family income in the United States with a correlation coefficient (R) of -0.394 and weighted average of $104,760. Similarly, the statistical analysis conducted on geographies consisting of 55,709,060 people shows a poor negative correlation between the proportion of Bermudans and median family income in the United States with a correlation coefficient (R) of -0.121 and weighted average of $97,577, a difference of 7.4%.
Median Family Income Correlation Summary
| Measurement | Basque | Bermudan |
| Minimum | $28,036 | $38,750 |
| Maximum | $157,351 | $163,000 |
| Range | $129,315 | $124,250 |
| Mean | $91,256 | $98,727 |
| Median | $94,457 | $96,344 |
| Interquartile 25% (IQ1) | $72,725 | $84,141 |
| Interquartile 75% (IQ3) | $105,919 | $116,507 |
| Interquartile Range (IQR) | $33,194 | $32,365 |
| Standard Deviation (Sample) | $26,783 | $27,353 |
| Standard Deviation (Population) | $26,606 | $27,067 |
Similar Demographics by Median Family Income
Demographics Similar to Basques by Median Family Income
In terms of median family income, the demographic groups most similar to Basques are Native Hawaiian ($104,910, a difference of 0.14%), Immigrants from Nepal ($104,966, a difference of 0.20%), Moroccan ($104,488, a difference of 0.26%), Scandinavian ($104,410, a difference of 0.34%), and Swiss ($104,396, a difference of 0.35%).
| Demographics | Rating | Rank | Median Family Income |
| Immigrants | Germany | 80.9 /100 | #149 | Excellent $105,507 |
| Irish | 80.5 /100 | #150 | Excellent $105,453 |
| Peruvians | 80.4 /100 | #151 | Excellent $105,444 |
| Immigrants | Albania | 79.1 /100 | #152 | Good $105,285 |
| Slavs | 77.9 /100 | #153 | Good $105,144 |
| Immigrants | Nepal | 76.3 /100 | #154 | Good $104,966 |
| Native Hawaiians | 75.8 /100 | #155 | Good $104,910 |
| Basques | 74.4 /100 | #156 | Good $104,760 |
| Moroccans | 71.6 /100 | #157 | Good $104,488 |
| Scandinavians | 70.8 /100 | #158 | Good $104,410 |
| Swiss | 70.7 /100 | #159 | Good $104,396 |
| Scottish | 69.5 /100 | #160 | Good $104,288 |
| Icelanders | 69.4 /100 | #161 | Good $104,282 |
| Immigrants | Sierra Leone | 66.2 /100 | #162 | Good $103,990 |
| Costa Ricans | 66.2 /100 | #163 | Good $103,989 |
Demographics Similar to Bermudans by Median Family Income
In terms of median family income, the demographic groups most similar to Bermudans are Immigrants from Armenia ($97,605, a difference of 0.030%), Nigerian ($97,522, a difference of 0.060%), Panamanian ($97,683, a difference of 0.11%), Immigrants from Bosnia and Herzegovina ($97,432, a difference of 0.15%), and Immigrants from Sudan ($97,737, a difference of 0.16%).
| Demographics | Rating | Rank | Median Family Income |
| Aleuts | 11.6 /100 | #207 | Poor $98,702 |
| Immigrants | Uruguay | 9.2 /100 | #208 | Tragic $98,205 |
| Immigrants | Colombia | 8.7 /100 | #209 | Tragic $98,067 |
| Puget Sound Salish | 8.2 /100 | #210 | Tragic $97,958 |
| Immigrants | Sudan | 7.4 /100 | #211 | Tragic $97,737 |
| Panamanians | 7.2 /100 | #212 | Tragic $97,683 |
| Immigrants | Armenia | 7.0 /100 | #213 | Tragic $97,605 |
| Bermudans | 6.9 /100 | #214 | Tragic $97,577 |
| Nigerians | 6.7 /100 | #215 | Tragic $97,522 |
| Immigrants | Bosnia and Herzegovina | 6.4 /100 | #216 | Tragic $97,432 |
| Japanese | 6.0 /100 | #217 | Tragic $97,288 |
| Immigrants | Cambodia | 5.8 /100 | #218 | Tragic $97,222 |
| Delaware | 5.1 /100 | #219 | Tragic $96,958 |
| Sudanese | 4.7 /100 | #220 | Tragic $96,783 |
| Immigrants | Ghana | 4.2 /100 | #221 | Tragic $96,544 |