Costa Rican vs Slavic Per Capita Income
COMPARE
Costa Rican
Slavic
Per Capita Income
Per Capita Income Comparison
Costa Ricans
Slavs
$44,090
PER CAPITA INCOME
61.8/ 100
METRIC RATING
161st/ 347
METRIC RANK
$45,049
PER CAPITA INCOME
82.6/ 100
METRIC RATING
141st/ 347
METRIC RANK
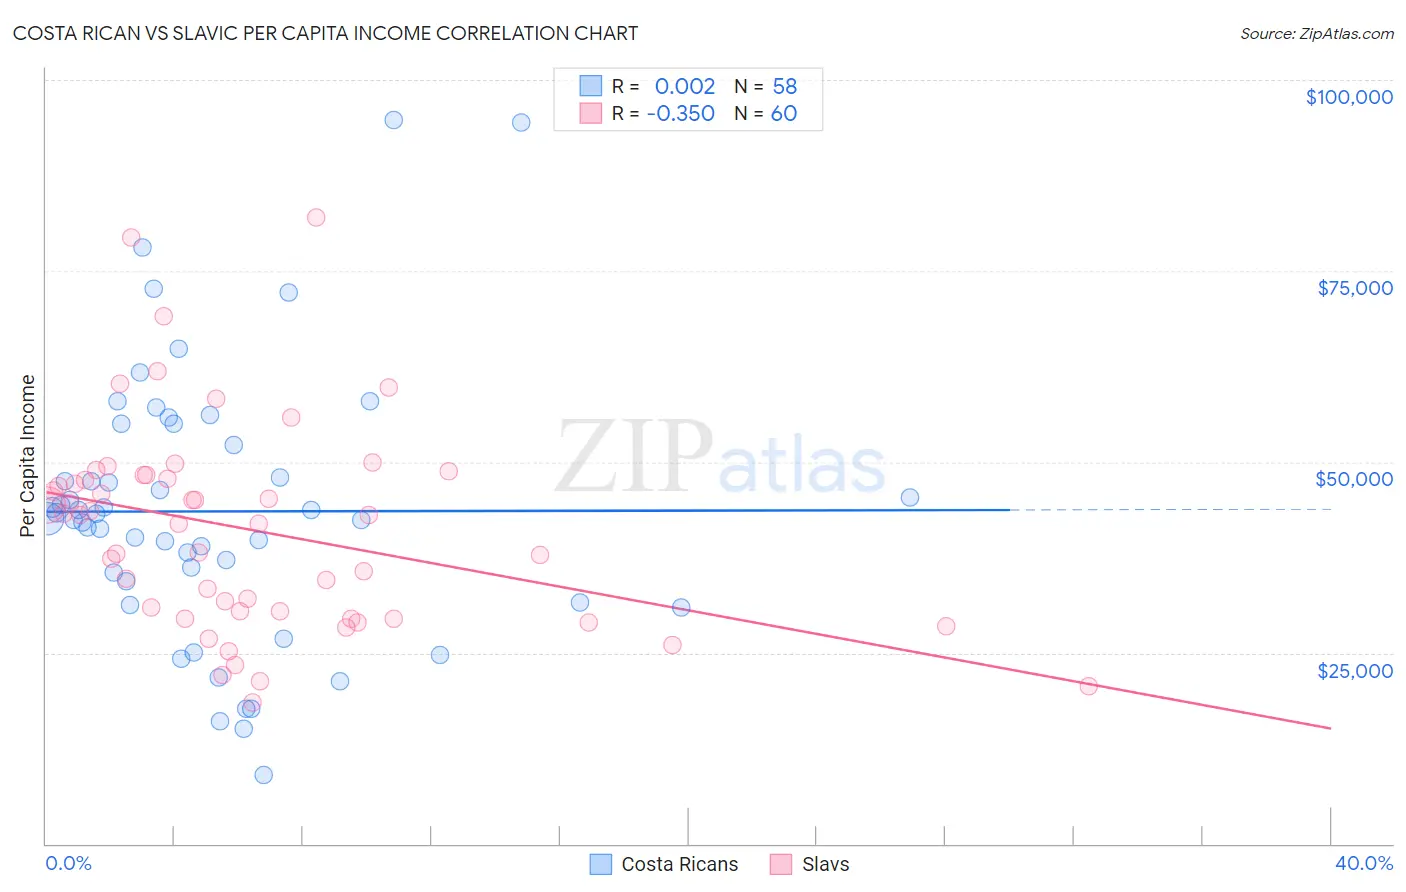
Costa Rican vs Slavic Per Capita Income Correlation Chart
The statistical analysis conducted on geographies consisting of 253,595,957 people shows no correlation between the proportion of Costa Ricans and per capita income in the United States with a correlation coefficient (R) of 0.002 and weighted average of $44,090. Similarly, the statistical analysis conducted on geographies consisting of 270,856,611 people shows a mild negative correlation between the proportion of Slavs and per capita income in the United States with a correlation coefficient (R) of -0.350 and weighted average of $45,049, a difference of 2.2%.
Per Capita Income Correlation Summary
| Measurement | Costa Rican | Slavic |
| Minimum | $9,066 | $18,507 |
| Maximum | $94,709 | $81,943 |
| Range | $85,643 | $63,436 |
| Mean | $43,514 | $41,079 |
| Median | $42,885 | $42,528 |
| Interquartile 25% (IQ1) | $34,433 | $30,000 |
| Interquartile 75% (IQ3) | $52,139 | $48,077 |
| Interquartile Range (IQR) | $17,706 | $18,077 |
| Standard Deviation (Sample) | $17,472 | $13,481 |
| Standard Deviation (Population) | $17,321 | $13,368 |
Demographics Similar to Costa Ricans and Slavs by Per Capita Income
In terms of per capita income, the demographic groups most similar to Costa Ricans are Danish ($44,095, a difference of 0.010%), South American ($44,114, a difference of 0.050%), Immigrants from Nepal ($44,187, a difference of 0.22%), South American Indian ($44,206, a difference of 0.26%), and Slovak ($44,229, a difference of 0.31%). Similarly, the demographic groups most similar to Slavs are Ugandan ($45,047, a difference of 0.0%), Immigrants from Uganda ($45,043, a difference of 0.010%), Icelander ($44,987, a difference of 0.14%), Immigrants from Afghanistan ($44,790, a difference of 0.58%), and Irish ($44,679, a difference of 0.83%).
| Demographics | Rating | Rank | Per Capita Income |
| Slavs | 82.6 /100 | #141 | Excellent $45,049 |
| Ugandans | 82.6 /100 | #142 | Excellent $45,047 |
| Immigrants | Uganda | 82.5 /100 | #143 | Excellent $45,043 |
| Icelanders | 81.6 /100 | #144 | Excellent $44,987 |
| Immigrants | Afghanistan | 78.0 /100 | #145 | Good $44,790 |
| Irish | 75.8 /100 | #146 | Good $44,679 |
| Czechs | 74.1 /100 | #147 | Good $44,595 |
| Immigrants | Armenia | 73.1 /100 | #148 | Good $44,552 |
| Koreans | 72.5 /100 | #149 | Good $44,522 |
| Immigrants | Eritrea | 72.1 /100 | #150 | Good $44,509 |
| Norwegians | 71.5 /100 | #151 | Good $44,480 |
| Peruvians | 71.5 /100 | #152 | Good $44,479 |
| Scottish | 70.6 /100 | #153 | Good $44,440 |
| Portuguese | 68.7 /100 | #154 | Good $44,362 |
| Uruguayans | 67.6 /100 | #155 | Good $44,318 |
| Slovaks | 65.4 /100 | #156 | Good $44,229 |
| South American Indians | 64.8 /100 | #157 | Good $44,206 |
| Immigrants | Nepal | 64.3 /100 | #158 | Good $44,187 |
| South Americans | 62.4 /100 | #159 | Good $44,114 |
| Danes | 61.9 /100 | #160 | Good $44,095 |
| Costa Ricans | 61.8 /100 | #161 | Good $44,090 |