Comanche vs Uruguayan Unemployment Among Women with Children Under 6 years
COMPARE
Comanche
Uruguayan
Unemployment Among Women with Children Under 6 years
Unemployment Among Women with Children Under 6 years Comparison
Comanche
Uruguayans
8.0%
UNEMPLOYMENT AMONG WOMEN WITH CHILDREN UNDER 6 YEARS
4.3/ 100
METRIC RATING
235th/ 347
METRIC RANK
7.5%
UNEMPLOYMENT AMONG WOMEN WITH CHILDREN UNDER 6 YEARS
74.7/ 100
METRIC RATING
153rd/ 347
METRIC RANK
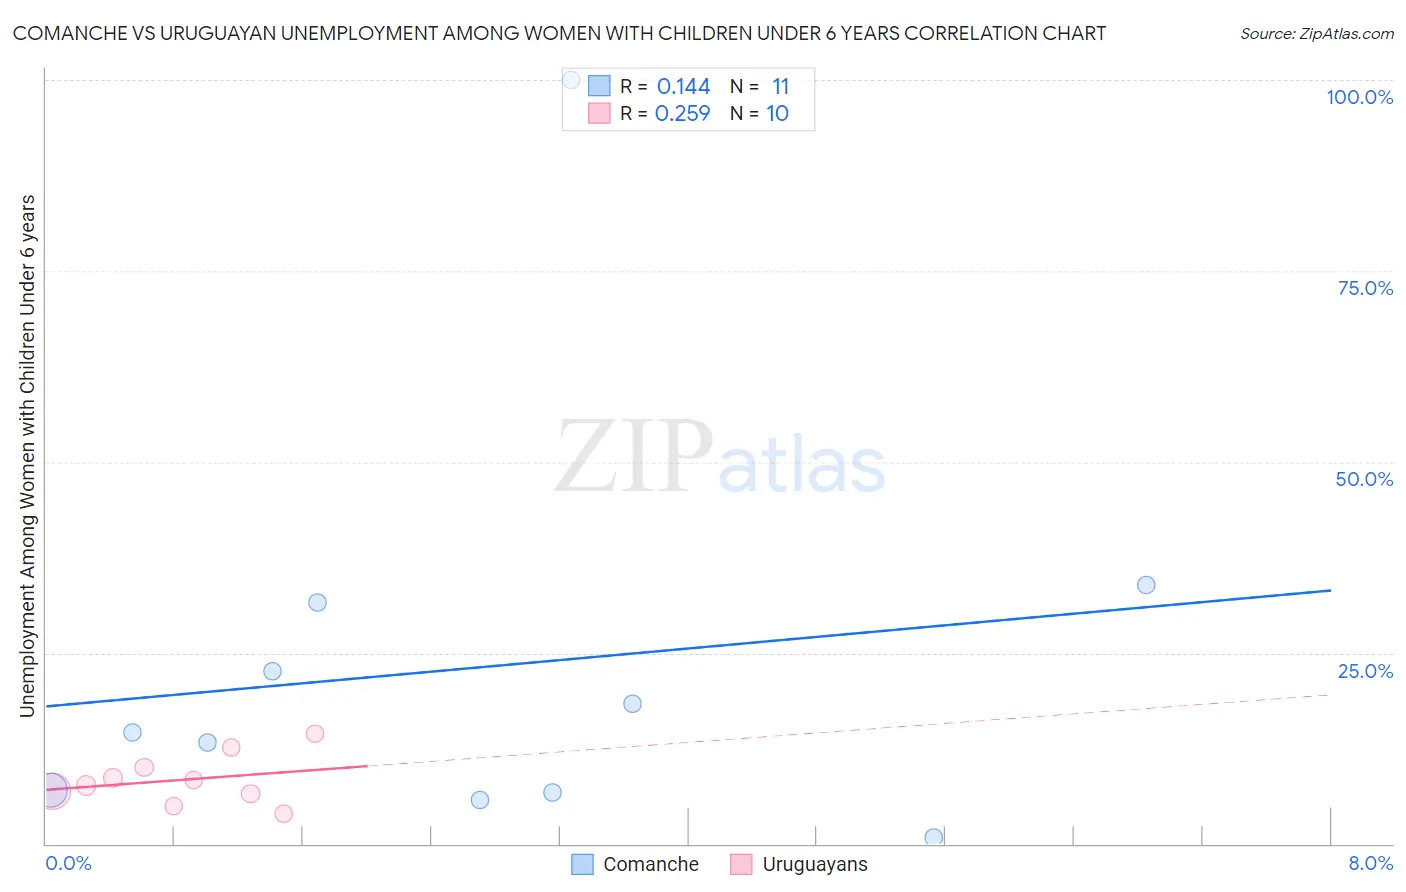
Comanche vs Uruguayan Unemployment Among Women with Children Under 6 years Correlation Chart
The statistical analysis conducted on geographies consisting of 96,385,597 people shows a poor positive correlation between the proportion of Comanche and unemployment rate among women with children under the age of 6 in the United States with a correlation coefficient (R) of 0.144 and weighted average of 8.0%. Similarly, the statistical analysis conducted on geographies consisting of 126,864,314 people shows a weak positive correlation between the proportion of Uruguayans and unemployment rate among women with children under the age of 6 in the United States with a correlation coefficient (R) of 0.259 and weighted average of 7.5%, a difference of 7.1%.
Unemployment Among Women with Children Under 6 years Correlation Summary
| Measurement | Comanche | Uruguayan |
| Minimum | 0.90% | 4.0% |
| Maximum | 100.0% | 14.4% |
| Range | 99.1% | 10.4% |
| Mean | 23.1% | 8.4% |
| Median | 14.6% | 8.0% |
| Interquartile 25% (IQ1) | 6.7% | 6.5% |
| Interquartile 75% (IQ3) | 31.6% | 10.0% |
| Interquartile Range (IQR) | 24.9% | 3.5% |
| Standard Deviation (Sample) | 27.6% | 3.2% |
| Standard Deviation (Population) | 26.3% | 3.1% |
Similar Demographics by Unemployment Among Women with Children Under 6 years
Demographics Similar to Comanche by Unemployment Among Women with Children Under 6 years
In terms of unemployment among women with children under 6 years, the demographic groups most similar to Comanche are Immigrants from Barbados (8.0%, a difference of 0.020%), Kiowa (8.0%, a difference of 0.040%), Immigrants from Costa Rica (8.0%, a difference of 0.080%), Immigrants from Trinidad and Tobago (8.0%, a difference of 0.18%), and Welsh (8.0%, a difference of 0.27%).
| Demographics | Rating | Rank | Unemployment Among Women with Children Under 6 years |
| Immigrants | Sudan | 6.0 /100 | #228 | Tragic 8.0% |
| Salvadorans | 5.5 /100 | #229 | Tragic 8.0% |
| Finns | 5.3 /100 | #230 | Tragic 8.0% |
| Trinidadians and Tobagonians | 5.3 /100 | #231 | Tragic 8.0% |
| Welsh | 5.0 /100 | #232 | Tragic 8.0% |
| Immigrants | Trinidad and Tobago | 4.8 /100 | #233 | Tragic 8.0% |
| Kiowa | 4.4 /100 | #234 | Tragic 8.0% |
| Comanche | 4.3 /100 | #235 | Tragic 8.0% |
| Immigrants | Barbados | 4.2 /100 | #236 | Tragic 8.0% |
| Immigrants | Costa Rica | 4.1 /100 | #237 | Tragic 8.0% |
| Immigrants | Middle Africa | 3.2 /100 | #238 | Tragic 8.1% |
| Irish | 2.7 /100 | #239 | Tragic 8.1% |
| Immigrants | El Salvador | 2.6 /100 | #240 | Tragic 8.1% |
| Liberians | 2.6 /100 | #241 | Tragic 8.1% |
| Dutch | 2.5 /100 | #242 | Tragic 8.1% |
Demographics Similar to Uruguayans by Unemployment Among Women with Children Under 6 years
In terms of unemployment among women with children under 6 years, the demographic groups most similar to Uruguayans are Bangladeshi (7.5%, a difference of 0.010%), Immigrants from Peru (7.5%, a difference of 0.020%), Northern European (7.5%, a difference of 0.030%), South American (7.5%, a difference of 0.050%), and Colombian (7.5%, a difference of 0.12%).
| Demographics | Rating | Rank | Unemployment Among Women with Children Under 6 years |
| Japanese | 78.9 /100 | #146 | Good 7.5% |
| Immigrants | Oceania | 78.4 /100 | #147 | Good 7.5% |
| Immigrants | Brazil | 77.3 /100 | #148 | Good 7.5% |
| Colombians | 76.1 /100 | #149 | Good 7.5% |
| Aleuts | 76.0 /100 | #150 | Good 7.5% |
| Immigrants | Peru | 74.9 /100 | #151 | Good 7.5% |
| Bangladeshis | 74.8 /100 | #152 | Good 7.5% |
| Uruguayans | 74.7 /100 | #153 | Good 7.5% |
| Northern Europeans | 74.3 /100 | #154 | Good 7.5% |
| South Americans | 74.1 /100 | #155 | Good 7.5% |
| Immigrants | Southern Europe | 73.2 /100 | #156 | Good 7.5% |
| Peruvians | 72.3 /100 | #157 | Good 7.5% |
| Croatians | 71.9 /100 | #158 | Good 7.5% |
| Immigrants | Philippines | 71.3 /100 | #159 | Good 7.5% |
| Bolivians | 70.8 /100 | #160 | Good 7.5% |