Colombian vs Immigrants from Western Africa No Schooling Completed
COMPARE
Colombian
Immigrants from Western Africa
No Schooling Completed
No Schooling Completed Comparison
Colombians
Immigrants from Western Africa
2.3%
NO SCHOOLING COMPLETED
3.2/ 100
METRIC RATING
232nd/ 347
METRIC RANK
2.6%
NO SCHOOLING COMPLETED
0.1/ 100
METRIC RATING
276th/ 347
METRIC RANK
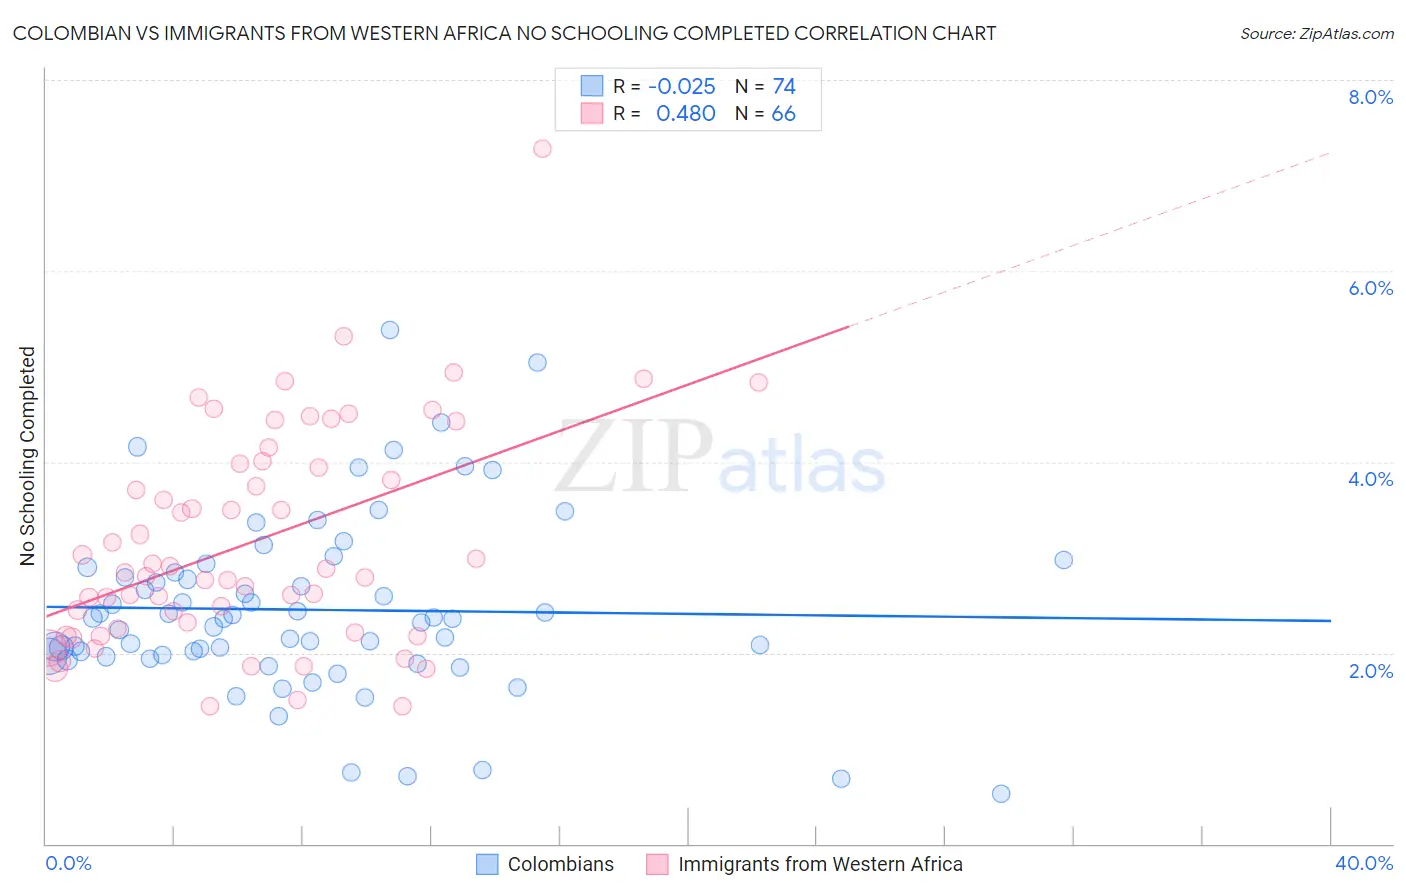
Colombian vs Immigrants from Western Africa No Schooling Completed Correlation Chart
The statistical analysis conducted on geographies consisting of 415,449,893 people shows no correlation between the proportion of Colombians and percentage of population with no schooling in the United States with a correlation coefficient (R) of -0.025 and weighted average of 2.3%. Similarly, the statistical analysis conducted on geographies consisting of 355,413,927 people shows a moderate positive correlation between the proportion of Immigrants from Western Africa and percentage of population with no schooling in the United States with a correlation coefficient (R) of 0.480 and weighted average of 2.6%, a difference of 10.5%.
No Schooling Completed Correlation Summary
| Measurement | Colombian | Immigrants from Western Africa |
| Minimum | 0.52% | 1.4% |
| Maximum | 5.4% | 7.3% |
| Range | 4.9% | 5.8% |
| Mean | 2.5% | 3.2% |
| Median | 2.4% | 2.9% |
| Interquartile 25% (IQ1) | 2.0% | 2.3% |
| Interquartile 75% (IQ3) | 2.8% | 4.0% |
| Interquartile Range (IQR) | 0.88% | 1.7% |
| Standard Deviation (Sample) | 0.93% | 1.1% |
| Standard Deviation (Population) | 0.92% | 1.1% |
Similar Demographics by No Schooling Completed
Demographics Similar to Colombians by No Schooling Completed
In terms of no schooling completed, the demographic groups most similar to Colombians are Immigrants from Uruguay (2.3%, a difference of 0.22%), Puerto Rican (2.3%, a difference of 0.25%), Immigrants from Malaysia (2.3%, a difference of 0.36%), Immigrants from Pakistan (2.3%, a difference of 0.38%), and U.S. Virgin Islander (2.3%, a difference of 0.47%).
| Demographics | Rating | Rank | No Schooling Completed |
| Sudanese | 4.1 /100 | #225 | Tragic 2.3% |
| Sierra Leoneans | 4.1 /100 | #226 | Tragic 2.3% |
| Immigrants | Uganda | 4.0 /100 | #227 | Tragic 2.3% |
| U.S. Virgin Islanders | 3.7 /100 | #228 | Tragic 2.3% |
| Immigrants | Pakistan | 3.6 /100 | #229 | Tragic 2.3% |
| Puerto Ricans | 3.4 /100 | #230 | Tragic 2.3% |
| Immigrants | Uruguay | 3.4 /100 | #231 | Tragic 2.3% |
| Colombians | 3.2 /100 | #232 | Tragic 2.3% |
| Immigrants | Malaysia | 2.8 /100 | #233 | Tragic 2.3% |
| Nigerians | 2.6 /100 | #234 | Tragic 2.3% |
| Immigrants | Western Asia | 2.6 /100 | #235 | Tragic 2.3% |
| Iraqis | 2.2 /100 | #236 | Tragic 2.4% |
| Immigrants | Eastern Asia | 2.0 /100 | #237 | Tragic 2.4% |
| Paiute | 1.9 /100 | #238 | Tragic 2.4% |
| Liberians | 1.8 /100 | #239 | Tragic 2.4% |
Demographics Similar to Immigrants from Western Africa by No Schooling Completed
In terms of no schooling completed, the demographic groups most similar to Immigrants from Western Africa are Immigrants from Philippines (2.6%, a difference of 0.050%), Immigrants from Uzbekistan (2.6%, a difference of 0.25%), Immigrants from China (2.6%, a difference of 0.56%), Ghanaian (2.6%, a difference of 0.74%), and Barbadian (2.6%, a difference of 0.80%).
| Demographics | Rating | Rank | No Schooling Completed |
| Immigrants | Nigeria | 0.2 /100 | #269 | Tragic 2.5% |
| Immigrants | Peru | 0.2 /100 | #270 | Tragic 2.5% |
| Cubans | 0.2 /100 | #271 | Tragic 2.5% |
| Immigrants | Bolivia | 0.2 /100 | #272 | Tragic 2.5% |
| Immigrants | Cameroon | 0.1 /100 | #273 | Tragic 2.5% |
| Ghanaians | 0.1 /100 | #274 | Tragic 2.6% |
| Immigrants | China | 0.1 /100 | #275 | Tragic 2.6% |
| Immigrants | Western Africa | 0.1 /100 | #276 | Tragic 2.6% |
| Immigrants | Philippines | 0.1 /100 | #277 | Tragic 2.6% |
| Immigrants | Uzbekistan | 0.1 /100 | #278 | Tragic 2.6% |
| Barbadians | 0.1 /100 | #279 | Tragic 2.6% |
| Trinidadians and Tobagonians | 0.1 /100 | #280 | Tragic 2.6% |
| Afghans | 0.1 /100 | #281 | Tragic 2.6% |
| Immigrants | Ghana | 0.1 /100 | #282 | Tragic 2.6% |
| Immigrants | Trinidad and Tobago | 0.0 /100 | #283 | Tragic 2.6% |