Sioux vs Immigrants from Western Africa Householder Income Ages 25 - 44 years
COMPARE
Sioux
Immigrants from Western Africa
Householder Income Ages 25 - 44 years
Householder Income Ages 25 - 44 years Comparison
Sioux
Immigrants from Western Africa
$77,089
HOUSEHOLDER INCOME AGES 25 - 44 YEARS
0.0/ 100
METRIC RATING
325th/ 347
METRIC RANK
$85,676
HOUSEHOLDER INCOME AGES 25 - 44 YEARS
0.7/ 100
METRIC RATING
252nd/ 347
METRIC RANK
Sioux vs Immigrants from Western Africa Householder Income Ages 25 - 44 years Correlation Chart
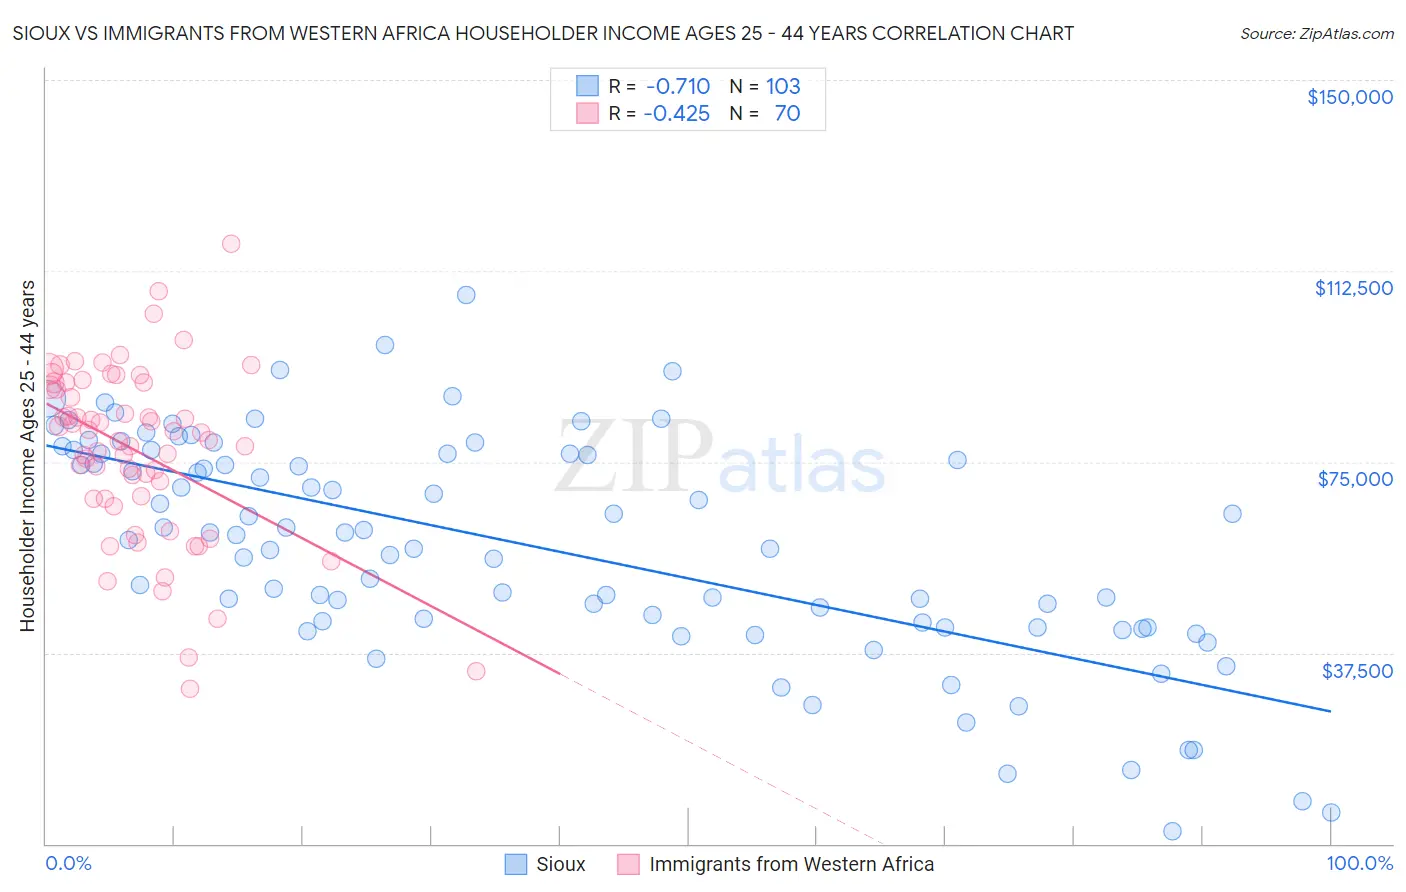
The statistical analysis conducted on geographies consisting of 233,739,759 people shows a strong negative correlation between the proportion of Sioux and household income with householder between the ages 25 and 44 in the United States with a correlation coefficient (R) of -0.710 and weighted average of $77,089. Similarly, the statistical analysis conducted on geographies consisting of 357,136,258 people shows a moderate negative correlation between the proportion of Immigrants from Western Africa and household income with householder between the ages 25 and 44 in the United States with a correlation coefficient (R) of -0.425 and weighted average of $85,676, a difference of 11.1%.
Householder Income Ages 25 - 44 years Correlation Summary
| Measurement | Sioux | Immigrants from Western Africa |
| Minimum | $2,499 | $30,517 |
| Maximum | $107,750 | $117,804 |
| Range | $105,251 | $87,287 |
| Mean | $58,364 | $77,170 |
| Median | $60,620 | $80,034 |
| Interquartile 25% (IQ1) | $42,554 | $67,813 |
| Interquartile 75% (IQ3) | $76,563 | $90,526 |
| Interquartile Range (IQR) | $34,009 | $22,713 |
| Standard Deviation (Sample) | $21,906 | $17,090 |
| Standard Deviation (Population) | $21,799 | $16,967 |
Similar Demographics by Householder Income Ages 25 - 44 years
Demographics Similar to Sioux by Householder Income Ages 25 - 44 years
In terms of householder income ages 25 - 44 years, the demographic groups most similar to Sioux are Houma ($77,044, a difference of 0.060%), Dutch West Indian ($77,260, a difference of 0.22%), Immigrants from Bahamas ($76,910, a difference of 0.23%), Immigrants from Honduras ($77,328, a difference of 0.31%), and Immigrants from Cuba ($76,701, a difference of 0.51%).
| Demographics | Rating | Rank | Householder Income Ages 25 - 44 years |
| Immigrants | Mexico | 0.0 /100 | #318 | Tragic $78,809 |
| Hondurans | 0.0 /100 | #319 | Tragic $78,540 |
| Choctaw | 0.0 /100 | #320 | Tragic $78,168 |
| Immigrants | Zaire | 0.0 /100 | #321 | Tragic $78,045 |
| Chickasaw | 0.0 /100 | #322 | Tragic $77,929 |
| Immigrants | Honduras | 0.0 /100 | #323 | Tragic $77,328 |
| Dutch West Indians | 0.0 /100 | #324 | Tragic $77,260 |
| Sioux | 0.0 /100 | #325 | Tragic $77,089 |
| Houma | 0.0 /100 | #326 | Tragic $77,044 |
| Immigrants | Bahamas | 0.0 /100 | #327 | Tragic $76,910 |
| Immigrants | Cuba | 0.0 /100 | #328 | Tragic $76,701 |
| Seminole | 0.0 /100 | #329 | Tragic $76,584 |
| Yakama | 0.0 /100 | #330 | Tragic $76,226 |
| Natives/Alaskans | 0.0 /100 | #331 | Tragic $75,647 |
| Bahamians | 0.0 /100 | #332 | Tragic $75,395 |
Demographics Similar to Immigrants from Western Africa by Householder Income Ages 25 - 44 years
In terms of householder income ages 25 - 44 years, the demographic groups most similar to Immigrants from Western Africa are Cape Verdean ($85,758, a difference of 0.10%), British West Indian ($85,565, a difference of 0.13%), Immigrants from Laos ($85,553, a difference of 0.14%), Pennsylvania German ($85,836, a difference of 0.19%), and French American Indian ($85,899, a difference of 0.26%).
| Demographics | Rating | Rank | Householder Income Ages 25 - 44 years |
| Immigrants | El Salvador | 1.4 /100 | #245 | Tragic $86,913 |
| Immigrants | Burma/Myanmar | 1.3 /100 | #246 | Tragic $86,736 |
| Immigrants | Nigeria | 1.2 /100 | #247 | Tragic $86,589 |
| Immigrants | Sudan | 0.9 /100 | #248 | Tragic $86,109 |
| French American Indians | 0.8 /100 | #249 | Tragic $85,899 |
| Pennsylvania Germans | 0.8 /100 | #250 | Tragic $85,836 |
| Cape Verdeans | 0.8 /100 | #251 | Tragic $85,758 |
| Immigrants | Western Africa | 0.7 /100 | #252 | Tragic $85,676 |
| British West Indians | 0.7 /100 | #253 | Tragic $85,565 |
| Immigrants | Laos | 0.7 /100 | #254 | Tragic $85,553 |
| German Russians | 0.6 /100 | #255 | Tragic $85,220 |
| Central Americans | 0.5 /100 | #256 | Tragic $85,144 |
| Mexican American Indians | 0.5 /100 | #257 | Tragic $85,066 |
| Immigrants | Nicaragua | 0.5 /100 | #258 | Tragic $84,914 |
| Immigrants | Senegal | 0.5 /100 | #259 | Tragic $84,848 |