Colombian vs Immigrants from Western Africa Family Poverty
COMPARE
Colombian
Immigrants from Western Africa
Family Poverty
Family Poverty Comparison
Colombians
Immigrants from Western Africa
9.2%
FAMILY POVERTY
36.1/ 100
METRIC RATING
186th/ 347
METRIC RANK
10.7%
FAMILY POVERTY
0.3/ 100
METRIC RATING
253rd/ 347
METRIC RANK
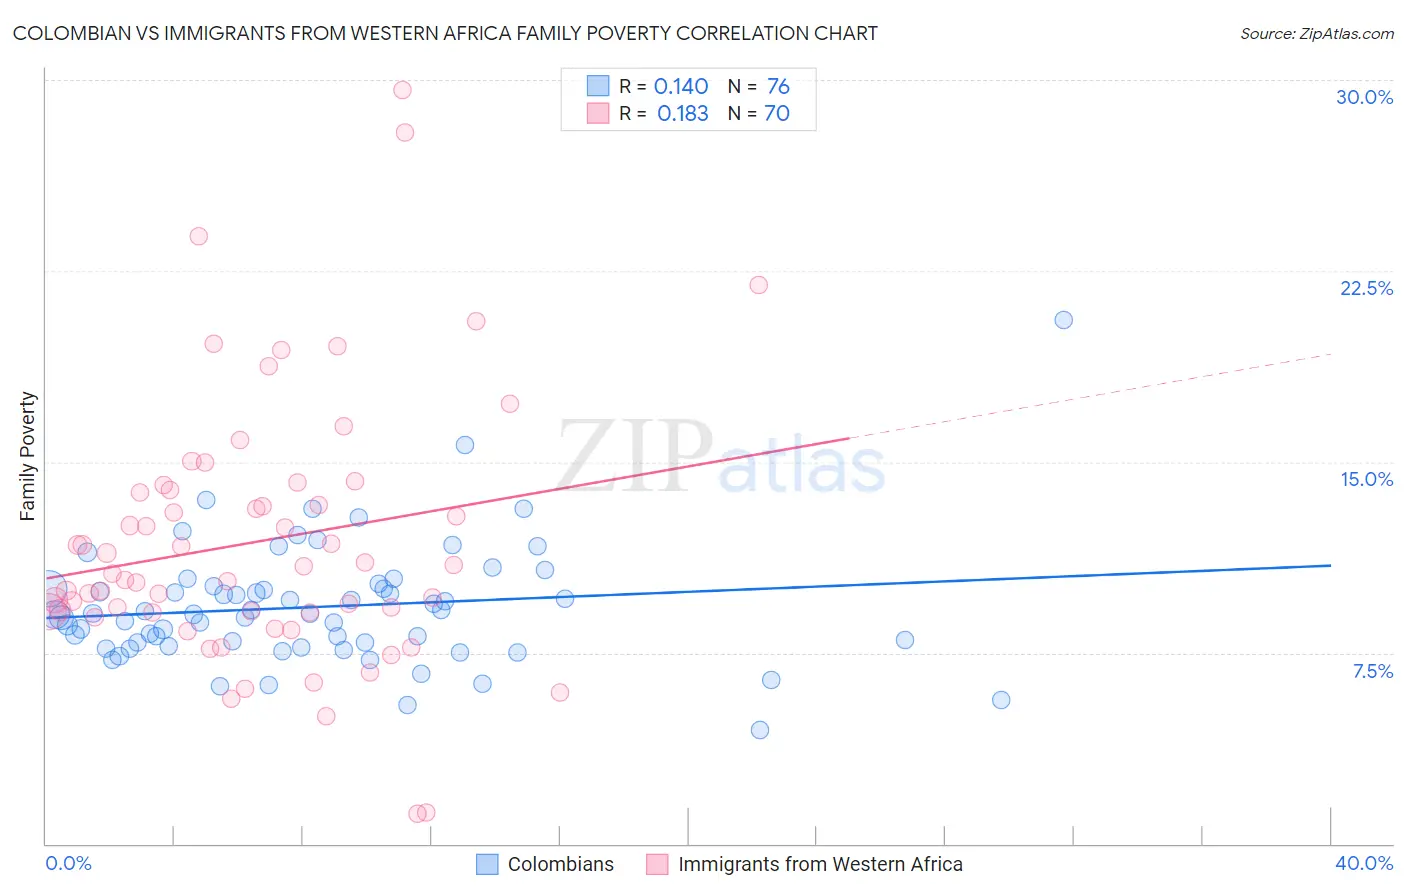
Colombian vs Immigrants from Western Africa Family Poverty Correlation Chart
The statistical analysis conducted on geographies consisting of 418,403,011 people shows a poor positive correlation between the proportion of Colombians and poverty level among families in the United States with a correlation coefficient (R) of 0.140 and weighted average of 9.2%. Similarly, the statistical analysis conducted on geographies consisting of 357,059,325 people shows a poor positive correlation between the proportion of Immigrants from Western Africa and poverty level among families in the United States with a correlation coefficient (R) of 0.183 and weighted average of 10.7%, a difference of 17.1%.
Family Poverty Correlation Summary
| Measurement | Colombian | Immigrants from Western Africa |
| Minimum | 4.5% | 1.2% |
| Maximum | 20.6% | 29.6% |
| Range | 16.1% | 28.4% |
| Mean | 9.3% | 11.9% |
| Median | 9.0% | 10.8% |
| Interquartile 25% (IQ1) | 7.8% | 9.1% |
| Interquartile 75% (IQ3) | 10.1% | 13.9% |
| Interquartile Range (IQR) | 2.3% | 4.8% |
| Standard Deviation (Sample) | 2.4% | 5.2% |
| Standard Deviation (Population) | 2.4% | 5.2% |
Similar Demographics by Family Poverty
Demographics Similar to Colombians by Family Poverty
In terms of family poverty, the demographic groups most similar to Colombians are Delaware (9.2%, a difference of 0.090%), Immigrants from Kenya (9.2%, a difference of 0.29%), Immigrants from Saudi Arabia (9.1%, a difference of 0.35%), South American Indian (9.1%, a difference of 0.36%), and Uruguayan (9.1%, a difference of 0.43%).
| Demographics | Rating | Rank | Family Poverty |
| Immigrants | Iraq | 44.4 /100 | #179 | Average 9.1% |
| Immigrants | Uganda | 43.4 /100 | #180 | Average 9.1% |
| Hmong | 40.2 /100 | #181 | Average 9.1% |
| Immigrants | Morocco | 40.2 /100 | #182 | Average 9.1% |
| Uruguayans | 39.2 /100 | #183 | Fair 9.1% |
| South American Indians | 38.7 /100 | #184 | Fair 9.1% |
| Immigrants | Saudi Arabia | 38.6 /100 | #185 | Fair 9.1% |
| Colombians | 36.1 /100 | #186 | Fair 9.2% |
| Delaware | 35.4 /100 | #187 | Fair 9.2% |
| Immigrants | Kenya | 34.0 /100 | #188 | Fair 9.2% |
| Immigrants | Afghanistan | 32.1 /100 | #189 | Fair 9.2% |
| Arabs | 31.5 /100 | #190 | Fair 9.2% |
| Ugandans | 28.7 /100 | #191 | Fair 9.3% |
| Spanish | 28.7 /100 | #192 | Fair 9.3% |
| Immigrants | Western Asia | 28.2 /100 | #193 | Fair 9.3% |
Demographics Similar to Immigrants from Western Africa by Family Poverty
In terms of family poverty, the demographic groups most similar to Immigrants from Western Africa are Immigrants from Zaire (10.7%, a difference of 0.11%), Iroquois (10.7%, a difference of 0.23%), Ecuadorian (10.8%, a difference of 0.30%), Salvadoran (10.7%, a difference of 0.51%), and Immigrants from Liberia (10.8%, a difference of 0.68%).
| Demographics | Rating | Rank | Family Poverty |
| Cherokee | 0.5 /100 | #246 | Tragic 10.6% |
| Liberians | 0.4 /100 | #247 | Tragic 10.6% |
| Nicaraguans | 0.4 /100 | #248 | Tragic 10.6% |
| Cubans | 0.4 /100 | #249 | Tragic 10.6% |
| Salvadorans | 0.3 /100 | #250 | Tragic 10.7% |
| Iroquois | 0.3 /100 | #251 | Tragic 10.7% |
| Immigrants | Zaire | 0.3 /100 | #252 | Tragic 10.7% |
| Immigrants | Western Africa | 0.3 /100 | #253 | Tragic 10.7% |
| Ecuadorians | 0.2 /100 | #254 | Tragic 10.8% |
| Immigrants | Liberia | 0.2 /100 | #255 | Tragic 10.8% |
| Chickasaw | 0.2 /100 | #256 | Tragic 10.8% |
| Immigrants | Ghana | 0.2 /100 | #257 | Tragic 10.8% |
| Sub-Saharan Africans | 0.2 /100 | #258 | Tragic 10.9% |
| Mexican American Indians | 0.2 /100 | #259 | Tragic 10.9% |
| Bangladeshis | 0.2 /100 | #260 | Tragic 10.9% |