Choctaw vs Salvadoran Per Capita Income
COMPARE
Choctaw
Salvadoran
Per Capita Income
Per Capita Income Comparison
Choctaw
Salvadorans
$35,999
PER CAPITA INCOME
0.0/ 100
METRIC RATING
316th/ 347
METRIC RANK
$38,858
PER CAPITA INCOME
0.5/ 100
METRIC RATING
266th/ 347
METRIC RANK
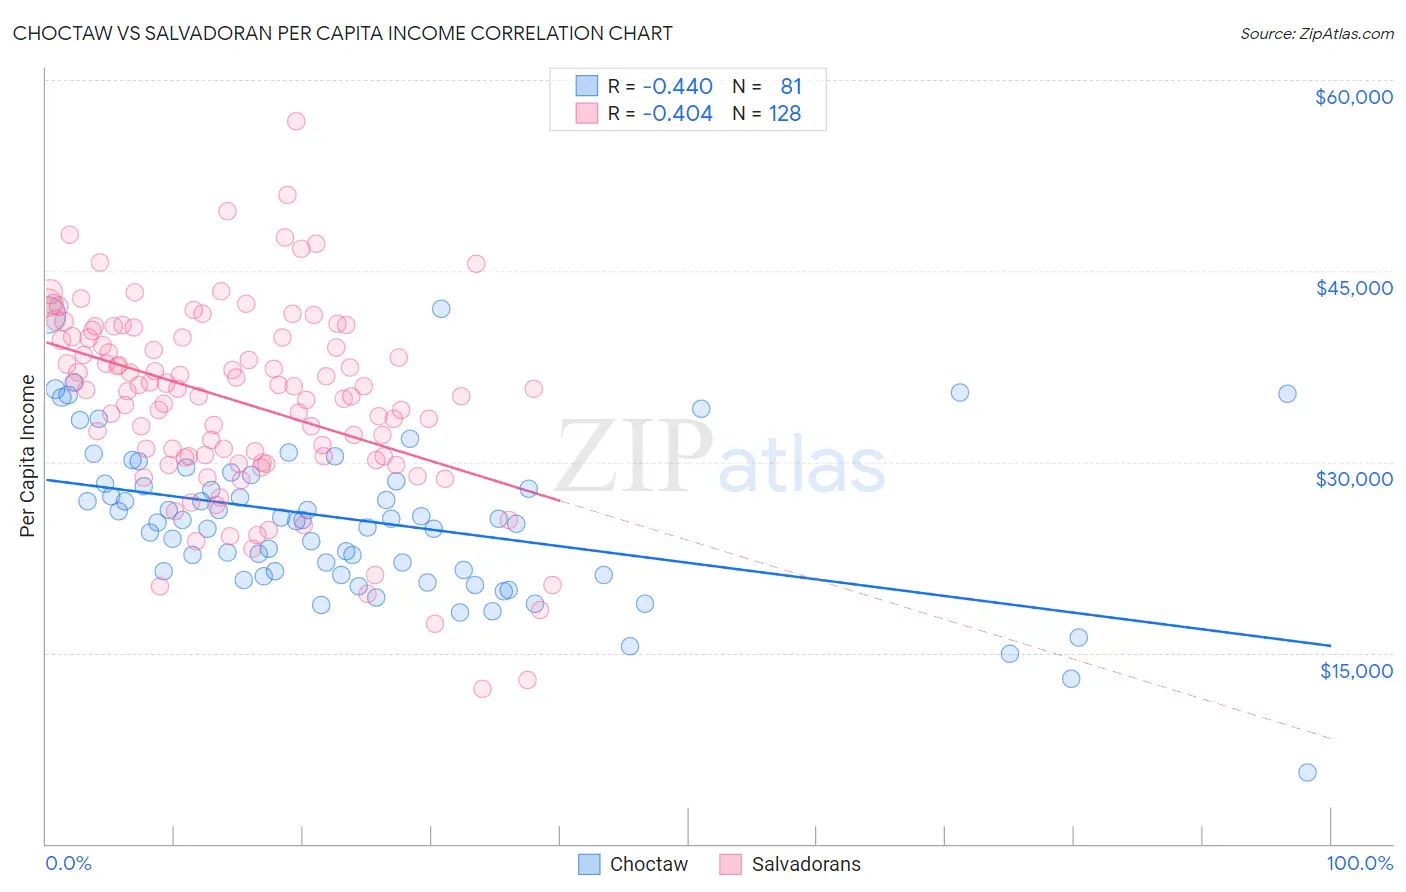
Choctaw vs Salvadoran Per Capita Income Correlation Chart
The statistical analysis conducted on geographies consisting of 269,743,960 people shows a moderate negative correlation between the proportion of Choctaw and per capita income in the United States with a correlation coefficient (R) of -0.440 and weighted average of $35,999. Similarly, the statistical analysis conducted on geographies consisting of 399,090,197 people shows a moderate negative correlation between the proportion of Salvadorans and per capita income in the United States with a correlation coefficient (R) of -0.404 and weighted average of $38,858, a difference of 7.9%.
Per Capita Income Correlation Summary
| Measurement | Choctaw | Salvadoran |
| Minimum | $5,606 | $12,183 |
| Maximum | $42,046 | $56,804 |
| Range | $36,440 | $44,621 |
| Mean | $25,429 | $34,754 |
| Median | $25,402 | $35,664 |
| Interquartile 25% (IQ1) | $21,238 | $30,375 |
| Interquartile 75% (IQ3) | $28,737 | $39,784 |
| Interquartile Range (IQR) | $7,499 | $9,409 |
| Standard Deviation (Sample) | $6,184 | $7,521 |
| Standard Deviation (Population) | $6,145 | $7,492 |
Similar Demographics by Per Capita Income
Demographics Similar to Choctaw by Per Capita Income
In terms of per capita income, the demographic groups most similar to Choctaw are Dutch West Indian ($35,922, a difference of 0.21%), Bangladeshi ($35,897, a difference of 0.28%), Yaqui ($36,112, a difference of 0.31%), Seminole ($36,180, a difference of 0.50%), and Immigrants from Congo ($35,720, a difference of 0.78%).
| Demographics | Rating | Rank | Per Capita Income |
| Immigrants | Honduras | 0.0 /100 | #309 | Tragic $36,665 |
| Ute | 0.0 /100 | #310 | Tragic $36,651 |
| Chippewa | 0.0 /100 | #311 | Tragic $36,631 |
| Chickasaw | 0.0 /100 | #312 | Tragic $36,475 |
| Bahamians | 0.0 /100 | #313 | Tragic $36,427 |
| Seminole | 0.0 /100 | #314 | Tragic $36,180 |
| Yaqui | 0.0 /100 | #315 | Tragic $36,112 |
| Choctaw | 0.0 /100 | #316 | Tragic $35,999 |
| Dutch West Indians | 0.0 /100 | #317 | Tragic $35,922 |
| Bangladeshis | 0.0 /100 | #318 | Tragic $35,897 |
| Immigrants | Congo | 0.0 /100 | #319 | Tragic $35,720 |
| Hispanics or Latinos | 0.0 /100 | #320 | Tragic $35,688 |
| Blacks/African Americans | 0.0 /100 | #321 | Tragic $35,564 |
| Creek | 0.0 /100 | #322 | Tragic $35,546 |
| Cheyenne | 0.0 /100 | #323 | Tragic $35,276 |
Demographics Similar to Salvadorans by Per Capita Income
In terms of per capita income, the demographic groups most similar to Salvadorans are Immigrants from Zaire ($38,848, a difference of 0.030%), Liberian ($38,780, a difference of 0.20%), Immigrants from Jamaica ($38,766, a difference of 0.24%), Spanish American ($39,012, a difference of 0.40%), and American ($39,039, a difference of 0.47%).
| Demographics | Rating | Rank | Per Capita Income |
| Malaysians | 0.7 /100 | #259 | Tragic $39,194 |
| Alaskan Athabascans | 0.6 /100 | #260 | Tragic $39,163 |
| Marshallese | 0.6 /100 | #261 | Tragic $39,108 |
| Iroquois | 0.6 /100 | #262 | Tragic $39,104 |
| Belizeans | 0.6 /100 | #263 | Tragic $39,097 |
| Americans | 0.6 /100 | #264 | Tragic $39,039 |
| Spanish Americans | 0.5 /100 | #265 | Tragic $39,012 |
| Salvadorans | 0.5 /100 | #266 | Tragic $38,858 |
| Immigrants | Zaire | 0.4 /100 | #267 | Tragic $38,848 |
| Liberians | 0.4 /100 | #268 | Tragic $38,780 |
| Immigrants | Jamaica | 0.4 /100 | #269 | Tragic $38,766 |
| Immigrants | Belize | 0.3 /100 | #270 | Tragic $38,614 |
| Central Americans | 0.3 /100 | #271 | Tragic $38,560 |
| Immigrants | Cabo Verde | 0.3 /100 | #272 | Tragic $38,540 |
| Nepalese | 0.3 /100 | #273 | Tragic $38,442 |