Dominican vs Immigrants from Sweden Median Household Income
COMPARE
Dominican
Immigrants from Sweden
Median Household Income
Median Household Income Comparison
Dominicans
Immigrants from Sweden
$71,302
MEDIAN HOUSEHOLD INCOME
0.0/ 100
METRIC RATING
314th/ 347
METRIC RANK
$100,699
MEDIAN HOUSEHOLD INCOME
100.0/ 100
METRIC RATING
25th/ 347
METRIC RANK
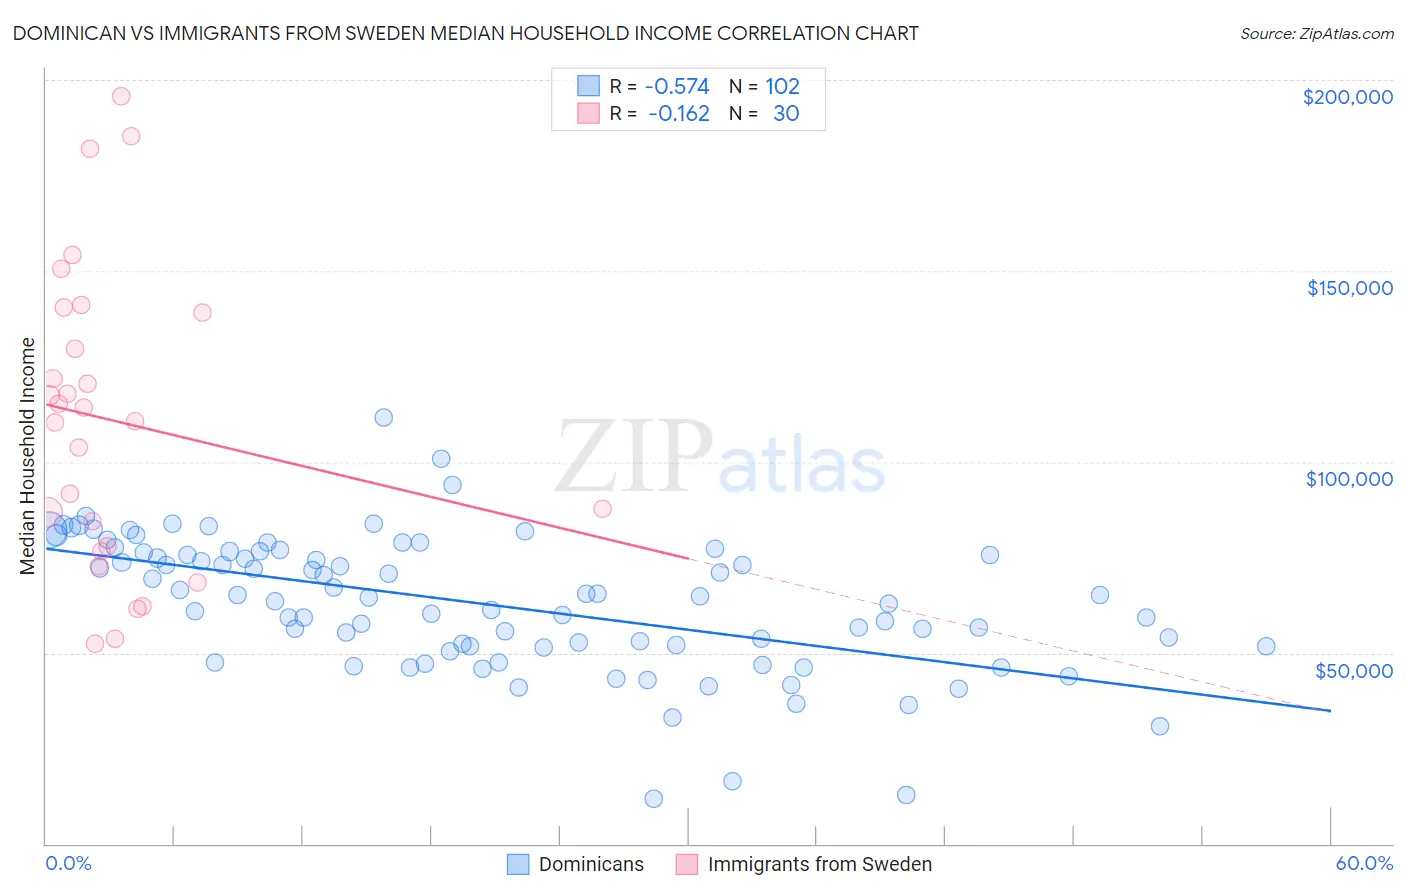
Dominican vs Immigrants from Sweden Median Household Income Correlation Chart
The statistical analysis conducted on geographies consisting of 354,675,302 people shows a substantial negative correlation between the proportion of Dominicans and median household income in the United States with a correlation coefficient (R) of -0.574 and weighted average of $71,302. Similarly, the statistical analysis conducted on geographies consisting of 164,698,337 people shows a poor negative correlation between the proportion of Immigrants from Sweden and median household income in the United States with a correlation coefficient (R) of -0.162 and weighted average of $100,699, a difference of 41.2%.
Median Household Income Correlation Summary
| Measurement | Dominican | Immigrants from Sweden |
| Minimum | $11,801 | $52,323 |
| Maximum | $111,701 | $195,586 |
| Range | $99,900 | $143,263 |
| Mean | $62,844 | $110,867 |
| Median | $64,590 | $112,526 |
| Interquartile 25% (IQ1) | $51,574 | $78,036 |
| Interquartile 75% (IQ3) | $76,260 | $139,219 |
| Interquartile Range (IQR) | $24,686 | $61,183 |
| Standard Deviation (Sample) | $17,716 | $38,839 |
| Standard Deviation (Population) | $17,629 | $38,186 |
Similar Demographics by Median Household Income
Demographics Similar to Dominicans by Median Household Income
In terms of median household income, the demographic groups most similar to Dominicans are Immigrants from Bahamas ($71,349, a difference of 0.060%), Immigrants from Honduras ($71,452, a difference of 0.21%), Ottawa ($70,984, a difference of 0.45%), Apache ($70,927, a difference of 0.53%), and Immigrants from Zaire ($71,801, a difference of 0.70%).
| Demographics | Rating | Rank | Median Household Income |
| Ute | 0.0 /100 | #307 | Tragic $72,402 |
| Yakama | 0.0 /100 | #308 | Tragic $72,225 |
| Immigrants | Caribbean | 0.0 /100 | #309 | Tragic $71,860 |
| U.S. Virgin Islanders | 0.0 /100 | #310 | Tragic $71,853 |
| Immigrants | Zaire | 0.0 /100 | #311 | Tragic $71,801 |
| Immigrants | Honduras | 0.0 /100 | #312 | Tragic $71,452 |
| Immigrants | Bahamas | 0.0 /100 | #313 | Tragic $71,349 |
| Dominicans | 0.0 /100 | #314 | Tragic $71,302 |
| Ottawa | 0.0 /100 | #315 | Tragic $70,984 |
| Apache | 0.0 /100 | #316 | Tragic $70,927 |
| Cajuns | 0.0 /100 | #317 | Tragic $70,605 |
| Chippewa | 0.0 /100 | #318 | Tragic $70,539 |
| Immigrants | Dominican Republic | 0.0 /100 | #319 | Tragic $70,208 |
| Colville | 0.0 /100 | #320 | Tragic $70,094 |
| Chickasaw | 0.0 /100 | #321 | Tragic $70,005 |
Demographics Similar to Immigrants from Sweden by Median Household Income
In terms of median household income, the demographic groups most similar to Immigrants from Sweden are Immigrants from Japan ($100,711, a difference of 0.010%), Immigrants from Belgium ($100,306, a difference of 0.39%), Bhutanese ($100,151, a difference of 0.55%), Immigrants from Bolivia ($101,394, a difference of 0.69%), and Immigrants from Sri Lanka ($99,943, a difference of 0.76%).
| Demographics | Rating | Rank | Median Household Income |
| Cypriots | 100.0 /100 | #18 | Exceptional $102,843 |
| Immigrants | Australia | 100.0 /100 | #19 | Exceptional $102,562 |
| Bolivians | 100.0 /100 | #20 | Exceptional $102,195 |
| Eastern Europeans | 100.0 /100 | #21 | Exceptional $101,781 |
| Asians | 100.0 /100 | #22 | Exceptional $101,681 |
| Immigrants | Bolivia | 100.0 /100 | #23 | Exceptional $101,394 |
| Immigrants | Japan | 100.0 /100 | #24 | Exceptional $100,711 |
| Immigrants | Sweden | 100.0 /100 | #25 | Exceptional $100,699 |
| Immigrants | Belgium | 100.0 /100 | #26 | Exceptional $100,306 |
| Bhutanese | 100.0 /100 | #27 | Exceptional $100,151 |
| Immigrants | Sri Lanka | 100.0 /100 | #28 | Exceptional $99,943 |
| Immigrants | Asia | 100.0 /100 | #29 | Exceptional $99,933 |
| Immigrants | Northern Europe | 100.0 /100 | #30 | Exceptional $99,813 |
| Turks | 100.0 /100 | #31 | Exceptional $99,389 |
| Immigrants | Denmark | 100.0 /100 | #32 | Exceptional $98,510 |