Immigrants from Congo vs Immigrants from Sweden Median Household Income
COMPARE
Immigrants from Congo
Immigrants from Sweden
Median Household Income
Median Household Income Comparison
Immigrants from Congo
Immigrants from Sweden
$66,768
MEDIAN HOUSEHOLD INCOME
0.0/ 100
METRIC RATING
336th/ 347
METRIC RANK
$100,699
MEDIAN HOUSEHOLD INCOME
100.0/ 100
METRIC RATING
25th/ 347
METRIC RANK
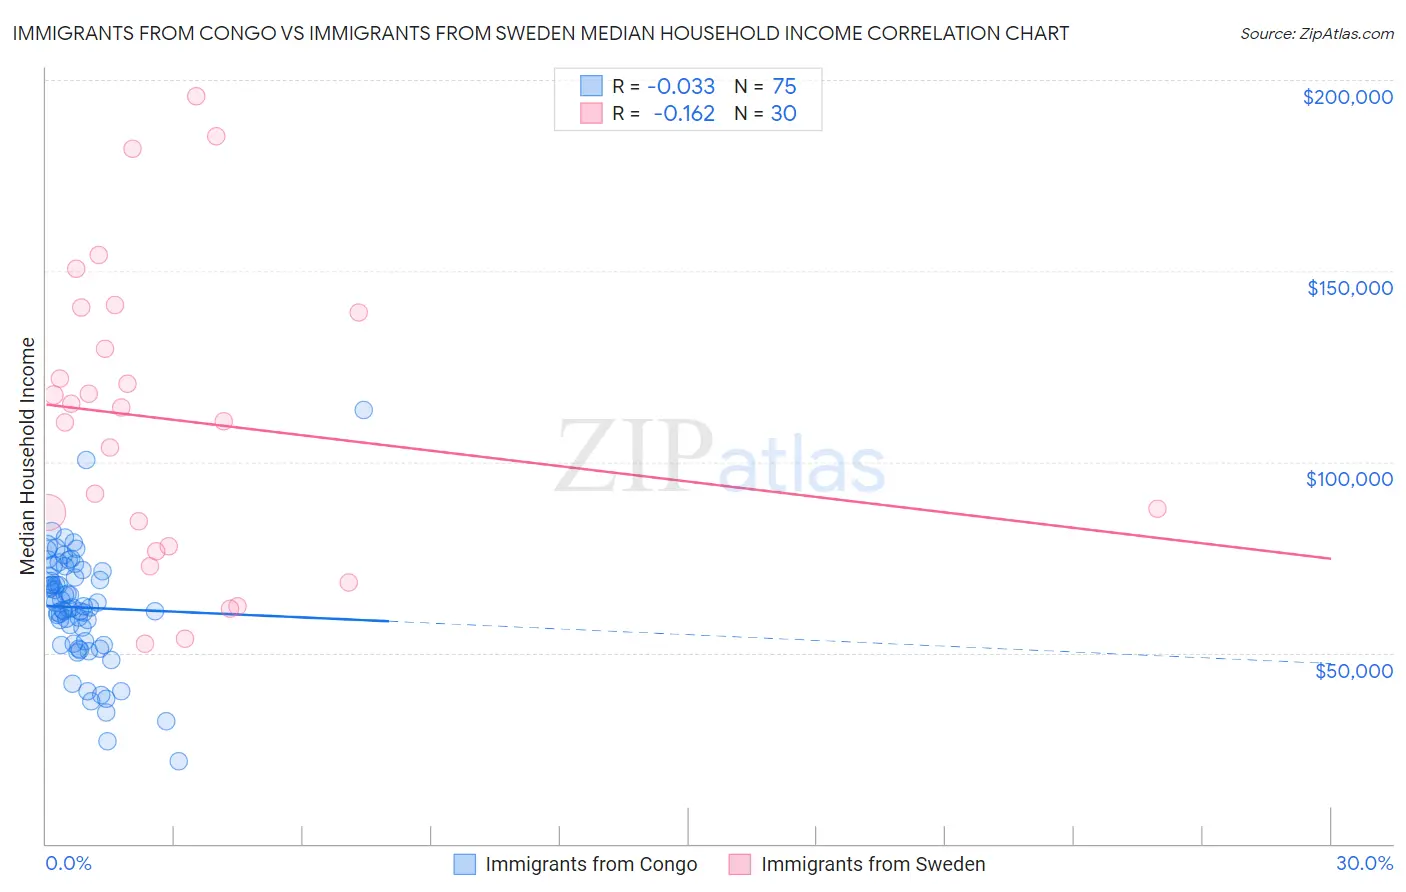
Immigrants from Congo vs Immigrants from Sweden Median Household Income Correlation Chart
The statistical analysis conducted on geographies consisting of 92,065,095 people shows no correlation between the proportion of Immigrants from Congo and median household income in the United States with a correlation coefficient (R) of -0.033 and weighted average of $66,768. Similarly, the statistical analysis conducted on geographies consisting of 164,698,337 people shows a poor negative correlation between the proportion of Immigrants from Sweden and median household income in the United States with a correlation coefficient (R) of -0.162 and weighted average of $100,699, a difference of 50.8%.
Median Household Income Correlation Summary
| Measurement | Immigrants from Congo | Immigrants from Sweden |
| Minimum | $21,567 | $52,323 |
| Maximum | $113,664 | $195,586 |
| Range | $92,097 | $143,263 |
| Mean | $61,890 | $110,867 |
| Median | $62,087 | $112,526 |
| Interquartile 25% (IQ1) | $52,383 | $78,036 |
| Interquartile 75% (IQ3) | $71,250 | $139,219 |
| Interquartile Range (IQR) | $18,867 | $61,183 |
| Standard Deviation (Sample) | $15,094 | $38,839 |
| Standard Deviation (Population) | $14,993 | $38,186 |
Similar Demographics by Median Household Income
Demographics Similar to Immigrants from Congo by Median Household Income
In terms of median household income, the demographic groups most similar to Immigrants from Congo are Cheyenne ($66,974, a difference of 0.31%), Black/African American ($67,573, a difference of 1.2%), Kiowa ($65,914, a difference of 1.3%), Creek ($67,715, a difference of 1.4%), and Sioux ($67,792, a difference of 1.5%).
| Demographics | Rating | Rank | Median Household Income |
| Dutch West Indians | 0.0 /100 | #329 | Tragic $68,412 |
| Arapaho | 0.0 /100 | #330 | Tragic $67,965 |
| Natives/Alaskans | 0.0 /100 | #331 | Tragic $67,879 |
| Sioux | 0.0 /100 | #332 | Tragic $67,792 |
| Creek | 0.0 /100 | #333 | Tragic $67,715 |
| Blacks/African Americans | 0.0 /100 | #334 | Tragic $67,573 |
| Cheyenne | 0.0 /100 | #335 | Tragic $66,974 |
| Immigrants | Congo | 0.0 /100 | #336 | Tragic $66,768 |
| Kiowa | 0.0 /100 | #337 | Tragic $65,914 |
| Immigrants | Yemen | 0.0 /100 | #338 | Tragic $65,194 |
| Hopi | 0.0 /100 | #339 | Tragic $65,043 |
| Pueblo | 0.0 /100 | #340 | Tragic $64,692 |
| Crow | 0.0 /100 | #341 | Tragic $63,681 |
| Pima | 0.0 /100 | #342 | Tragic $63,262 |
| Houma | 0.0 /100 | #343 | Tragic $62,575 |
Demographics Similar to Immigrants from Sweden by Median Household Income
In terms of median household income, the demographic groups most similar to Immigrants from Sweden are Immigrants from Japan ($100,711, a difference of 0.010%), Immigrants from Belgium ($100,306, a difference of 0.39%), Bhutanese ($100,151, a difference of 0.55%), Immigrants from Bolivia ($101,394, a difference of 0.69%), and Immigrants from Sri Lanka ($99,943, a difference of 0.76%).
| Demographics | Rating | Rank | Median Household Income |
| Cypriots | 100.0 /100 | #18 | Exceptional $102,843 |
| Immigrants | Australia | 100.0 /100 | #19 | Exceptional $102,562 |
| Bolivians | 100.0 /100 | #20 | Exceptional $102,195 |
| Eastern Europeans | 100.0 /100 | #21 | Exceptional $101,781 |
| Asians | 100.0 /100 | #22 | Exceptional $101,681 |
| Immigrants | Bolivia | 100.0 /100 | #23 | Exceptional $101,394 |
| Immigrants | Japan | 100.0 /100 | #24 | Exceptional $100,711 |
| Immigrants | Sweden | 100.0 /100 | #25 | Exceptional $100,699 |
| Immigrants | Belgium | 100.0 /100 | #26 | Exceptional $100,306 |
| Bhutanese | 100.0 /100 | #27 | Exceptional $100,151 |
| Immigrants | Sri Lanka | 100.0 /100 | #28 | Exceptional $99,943 |
| Immigrants | Asia | 100.0 /100 | #29 | Exceptional $99,933 |
| Immigrants | Northern Europe | 100.0 /100 | #30 | Exceptional $99,813 |
| Turks | 100.0 /100 | #31 | Exceptional $99,389 |
| Immigrants | Denmark | 100.0 /100 | #32 | Exceptional $98,510 |