Chilean vs Immigrants from Israel 6th Grade
COMPARE
Chilean
Immigrants from Israel
6th Grade
6th Grade Comparison
Chileans
Immigrants from Israel
97.1%
6TH GRADE
52.1/ 100
METRIC RATING
170th/ 347
METRIC RANK
97.2%
6TH GRADE
76.0/ 100
METRIC RATING
149th/ 347
METRIC RANK
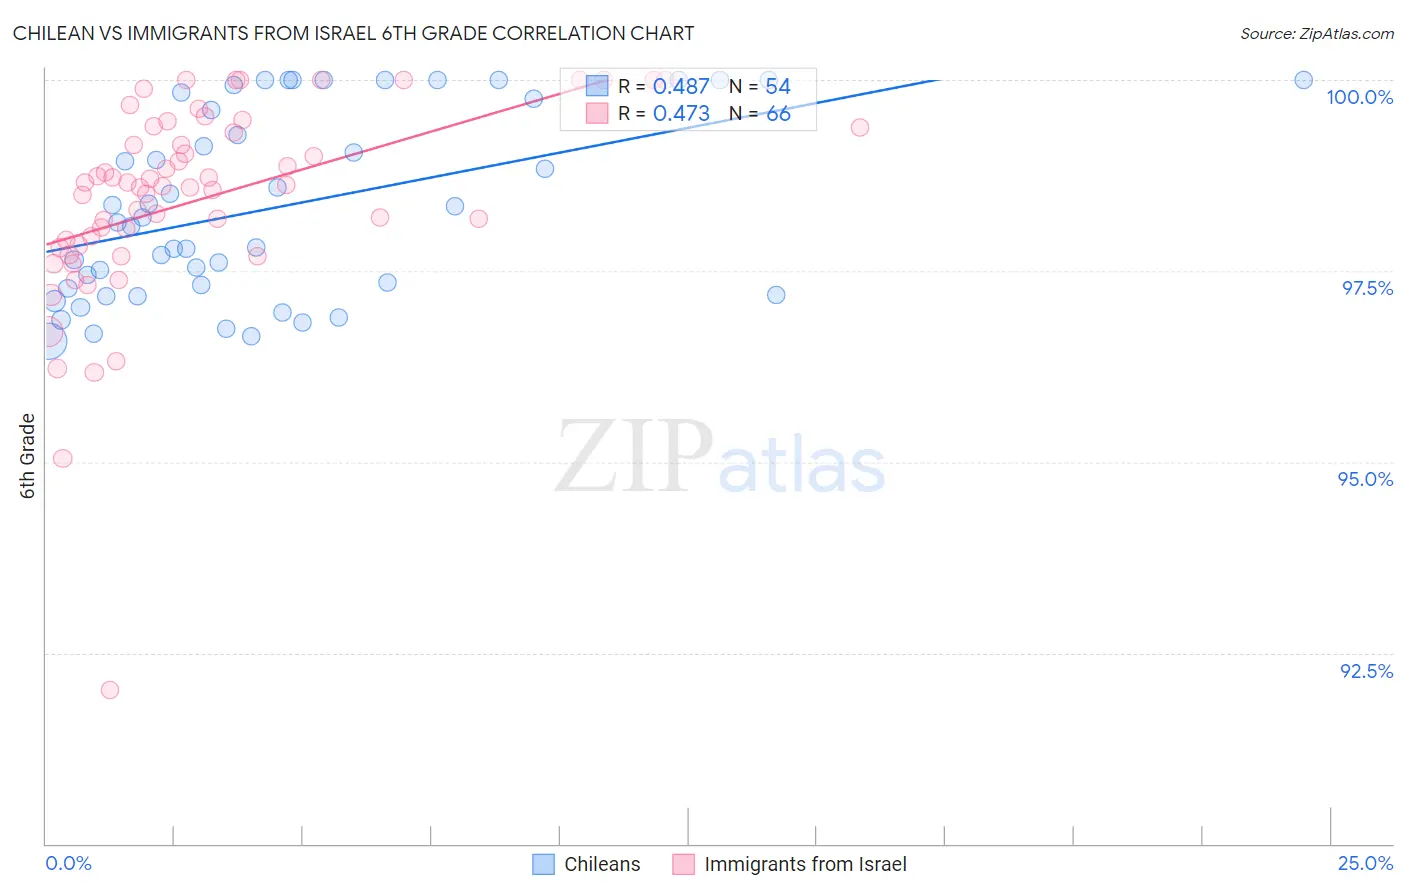
Chilean vs Immigrants from Israel 6th Grade Correlation Chart
The statistical analysis conducted on geographies consisting of 256,683,580 people shows a moderate positive correlation between the proportion of Chileans and percentage of population with at least 6th grade education in the United States with a correlation coefficient (R) of 0.487 and weighted average of 97.1%. Similarly, the statistical analysis conducted on geographies consisting of 210,029,773 people shows a moderate positive correlation between the proportion of Immigrants from Israel and percentage of population with at least 6th grade education in the United States with a correlation coefficient (R) of 0.473 and weighted average of 97.2%, a difference of 0.12%.
6th Grade Correlation Summary
| Measurement | Chilean | Immigrants from Israel |
| Minimum | 96.6% | 92.0% |
| Maximum | 100.0% | 100.0% |
| Range | 3.4% | 8.0% |
| Mean | 98.3% | 98.4% |
| Median | 98.2% | 98.6% |
| Interquartile 25% (IQ1) | 97.3% | 97.8% |
| Interquartile 75% (IQ3) | 99.8% | 99.4% |
| Interquartile Range (IQR) | 2.5% | 1.6% |
| Standard Deviation (Sample) | 1.2% | 1.3% |
| Standard Deviation (Population) | 1.2% | 1.3% |
Similar Demographics by 6th Grade
Demographics Similar to Chileans by 6th Grade
In terms of 6th grade, the demographic groups most similar to Chileans are Bermudan (97.1%, a difference of 0.0%), Immigrants from Sri Lanka (97.1%, a difference of 0.0%), Immigrants from Italy (97.1%, a difference of 0.010%), Apache (97.1%, a difference of 0.010%), and Immigrants from Taiwan (97.1%, a difference of 0.010%).
| Demographics | Rating | Rank | 6th Grade |
| Albanians | 57.8 /100 | #163 | Average 97.1% |
| Immigrants | Korea | 57.7 /100 | #164 | Average 97.1% |
| Immigrants | Poland | 56.2 /100 | #165 | Average 97.1% |
| Immigrants | Italy | 53.8 /100 | #166 | Average 97.1% |
| Apache | 53.6 /100 | #167 | Average 97.1% |
| Immigrants | Taiwan | 53.5 /100 | #168 | Average 97.1% |
| Bermudans | 52.6 /100 | #169 | Average 97.1% |
| Chileans | 52.1 /100 | #170 | Average 97.1% |
| Immigrants | Sri Lanka | 51.7 /100 | #171 | Average 97.1% |
| Egyptians | 50.9 /100 | #172 | Average 97.1% |
| Arabs | 50.1 /100 | #173 | Average 97.0% |
| Venezuelans | 50.0 /100 | #174 | Average 97.0% |
| Immigrants | Kazakhstan | 47.3 /100 | #175 | Average 97.0% |
| Immigrants | Micronesia | 47.1 /100 | #176 | Average 97.0% |
| Mongolians | 46.7 /100 | #177 | Average 97.0% |
Demographics Similar to Immigrants from Israel by 6th Grade
In terms of 6th grade, the demographic groups most similar to Immigrants from Israel are Immigrants from South Central Asia (97.2%, a difference of 0.010%), Immigrants from Greece (97.2%, a difference of 0.010%), Immigrants from Bosnia and Herzegovina (97.2%, a difference of 0.010%), French American Indian (97.2%, a difference of 0.010%), and Hopi (97.2%, a difference of 0.020%).
| Demographics | Rating | Rank | 6th Grade |
| Jordanians | 84.6 /100 | #142 | Excellent 97.2% |
| Pima | 82.9 /100 | #143 | Excellent 97.2% |
| Israelis | 82.9 /100 | #144 | Excellent 97.2% |
| Spaniards | 80.1 /100 | #145 | Excellent 97.2% |
| Hopi | 78.8 /100 | #146 | Good 97.2% |
| Immigrants | South Central Asia | 78.1 /100 | #147 | Good 97.2% |
| Immigrants | Greece | 77.8 /100 | #148 | Good 97.2% |
| Immigrants | Israel | 76.0 /100 | #149 | Good 97.2% |
| Immigrants | Bosnia and Herzegovina | 74.8 /100 | #150 | Good 97.2% |
| French American Indians | 74.0 /100 | #151 | Good 97.2% |
| Immigrants | Jordan | 73.0 /100 | #152 | Good 97.2% |
| Immigrants | Eastern Europe | 72.6 /100 | #153 | Good 97.2% |
| Soviet Union | 71.5 /100 | #154 | Good 97.2% |
| Ute | 71.1 /100 | #155 | Good 97.1% |
| Alsatians | 69.8 /100 | #156 | Good 97.1% |