Canadian vs Immigrants from Cabo Verde Per Capita Income
COMPARE
Canadian
Immigrants from Cabo Verde
Per Capita Income
Per Capita Income Comparison
Canadians
Immigrants from Cabo Verde
$45,858
PER CAPITA INCOME
92.2/ 100
METRIC RATING
121st/ 347
METRIC RANK
$38,540
PER CAPITA INCOME
0.3/ 100
METRIC RATING
272nd/ 347
METRIC RANK
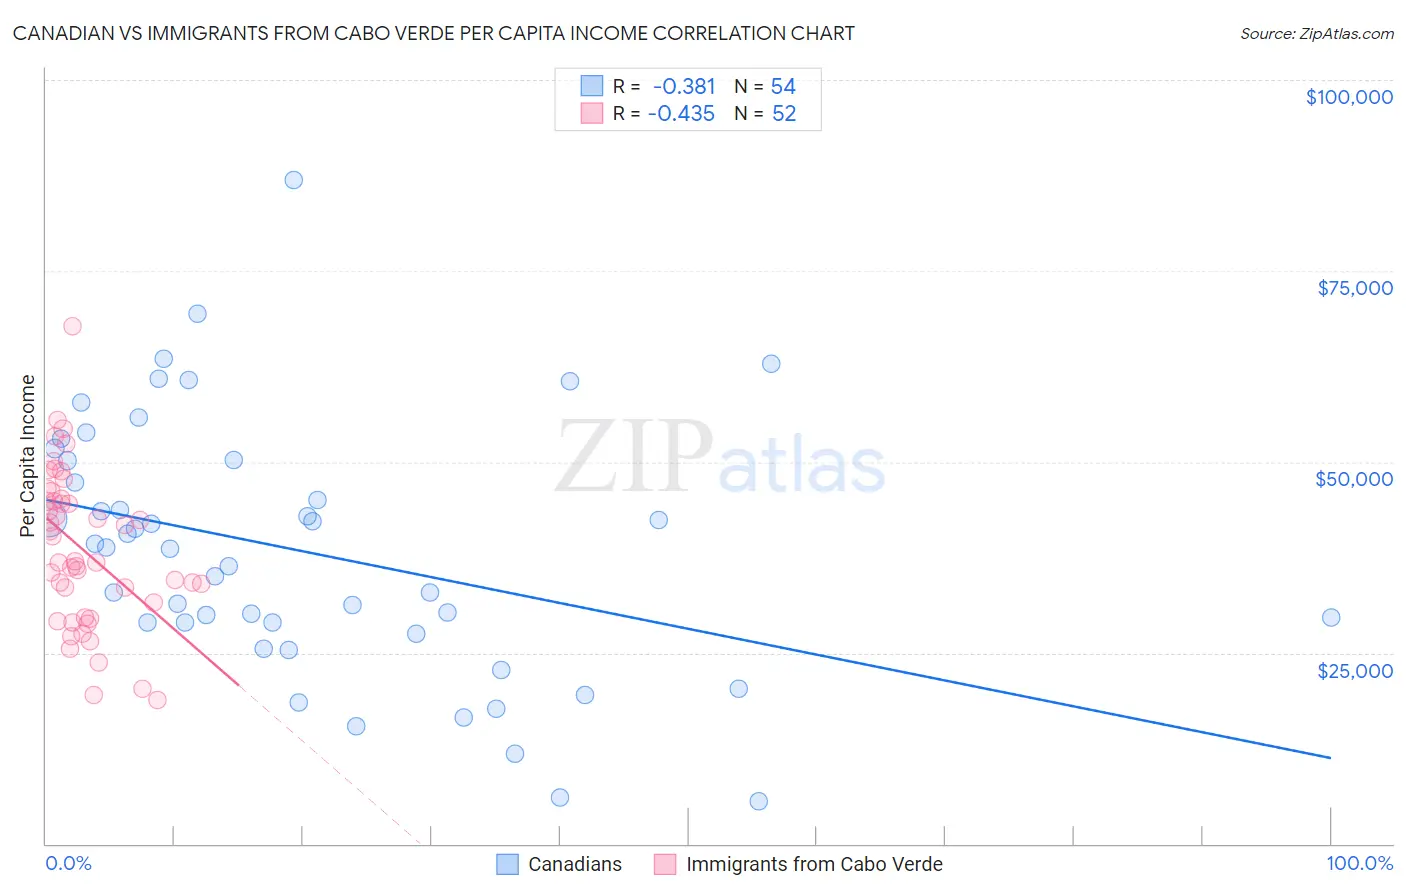
Canadian vs Immigrants from Cabo Verde Per Capita Income Correlation Chart
The statistical analysis conducted on geographies consisting of 437,574,482 people shows a mild negative correlation between the proportion of Canadians and per capita income in the United States with a correlation coefficient (R) of -0.381 and weighted average of $45,858. Similarly, the statistical analysis conducted on geographies consisting of 38,153,224 people shows a moderate negative correlation between the proportion of Immigrants from Cabo Verde and per capita income in the United States with a correlation coefficient (R) of -0.435 and weighted average of $38,540, a difference of 19.0%.
Per Capita Income Correlation Summary
| Measurement | Canadian | Immigrants from Cabo Verde |
| Minimum | $5,500 | $18,870 |
| Maximum | $86,868 | $67,818 |
| Range | $81,368 | $48,948 |
| Mean | $38,269 | $38,585 |
| Median | $38,676 | $36,913 |
| Interquartile 25% (IQ1) | $28,934 | $30,580 |
| Interquartile 75% (IQ3) | $50,164 | $45,064 |
| Interquartile Range (IQR) | $21,231 | $14,484 |
| Standard Deviation (Sample) | $16,643 | $10,185 |
| Standard Deviation (Population) | $16,488 | $10,087 |
Similar Demographics by Per Capita Income
Demographics Similar to Canadians by Per Capita Income
In terms of per capita income, the demographic groups most similar to Canadians are Moroccan ($45,854, a difference of 0.010%), Lebanese ($45,840, a difference of 0.040%), European ($45,836, a difference of 0.050%), Zimbabwean ($45,804, a difference of 0.12%), and Immigrants from Ethiopia ($45,923, a difference of 0.14%).
| Demographics | Rating | Rank | Per Capita Income |
| Afghans | 94.9 /100 | #114 | Exceptional $46,268 |
| Immigrants | Chile | 94.6 /100 | #115 | Exceptional $46,213 |
| Poles | 94.1 /100 | #116 | Exceptional $46,123 |
| Chinese | 93.9 /100 | #117 | Exceptional $46,098 |
| Immigrants | Saudi Arabia | 93.3 /100 | #118 | Exceptional $46,008 |
| Immigrants | Poland | 93.1 /100 | #119 | Exceptional $45,979 |
| Immigrants | Ethiopia | 92.7 /100 | #120 | Exceptional $45,923 |
| Canadians | 92.2 /100 | #121 | Exceptional $45,858 |
| Moroccans | 92.1 /100 | #122 | Exceptional $45,854 |
| Lebanese | 92.0 /100 | #123 | Exceptional $45,840 |
| Europeans | 92.0 /100 | #124 | Exceptional $45,836 |
| Zimbabweans | 91.7 /100 | #125 | Exceptional $45,804 |
| Palestinians | 91.6 /100 | #126 | Exceptional $45,790 |
| Immigrants | Germany | 91.3 /100 | #127 | Exceptional $45,751 |
| Swedes | 91.3 /100 | #128 | Exceptional $45,750 |
Demographics Similar to Immigrants from Cabo Verde by Per Capita Income
In terms of per capita income, the demographic groups most similar to Immigrants from Cabo Verde are Central American ($38,560, a difference of 0.050%), Immigrants from Belize ($38,614, a difference of 0.19%), Nepalese ($38,442, a difference of 0.25%), Immigrants from El Salvador ($38,394, a difference of 0.38%), and Immigrants from Jamaica ($38,766, a difference of 0.59%).
| Demographics | Rating | Rank | Per Capita Income |
| Spanish Americans | 0.5 /100 | #265 | Tragic $39,012 |
| Salvadorans | 0.5 /100 | #266 | Tragic $38,858 |
| Immigrants | Zaire | 0.4 /100 | #267 | Tragic $38,848 |
| Liberians | 0.4 /100 | #268 | Tragic $38,780 |
| Immigrants | Jamaica | 0.4 /100 | #269 | Tragic $38,766 |
| Immigrants | Belize | 0.3 /100 | #270 | Tragic $38,614 |
| Central Americans | 0.3 /100 | #271 | Tragic $38,560 |
| Immigrants | Cabo Verde | 0.3 /100 | #272 | Tragic $38,540 |
| Nepalese | 0.3 /100 | #273 | Tragic $38,442 |
| Immigrants | El Salvador | 0.3 /100 | #274 | Tragic $38,394 |
| Immigrants | Liberia | 0.2 /100 | #275 | Tragic $38,165 |
| Hmong | 0.2 /100 | #276 | Tragic $38,120 |
| Comanche | 0.2 /100 | #277 | Tragic $38,088 |
| Immigrants | Nicaragua | 0.2 /100 | #278 | Tragic $38,065 |
| Colville | 0.2 /100 | #279 | Tragic $38,047 |