Chickasaw vs Immigrants from Saudi Arabia Householder Income Ages 45 - 64 years
COMPARE
Chickasaw
Immigrants from Saudi Arabia
Householder Income Ages 45 - 64 years
Householder Income Ages 45 - 64 years Comparison
Chickasaw
Immigrants from Saudi Arabia
$82,193
HOUSEHOLDER INCOME AGES 45 - 64 YEARS
0.0/ 100
METRIC RATING
319th/ 347
METRIC RANK
$105,249
HOUSEHOLDER INCOME AGES 45 - 64 YEARS
92.2/ 100
METRIC RATING
127th/ 347
METRIC RANK
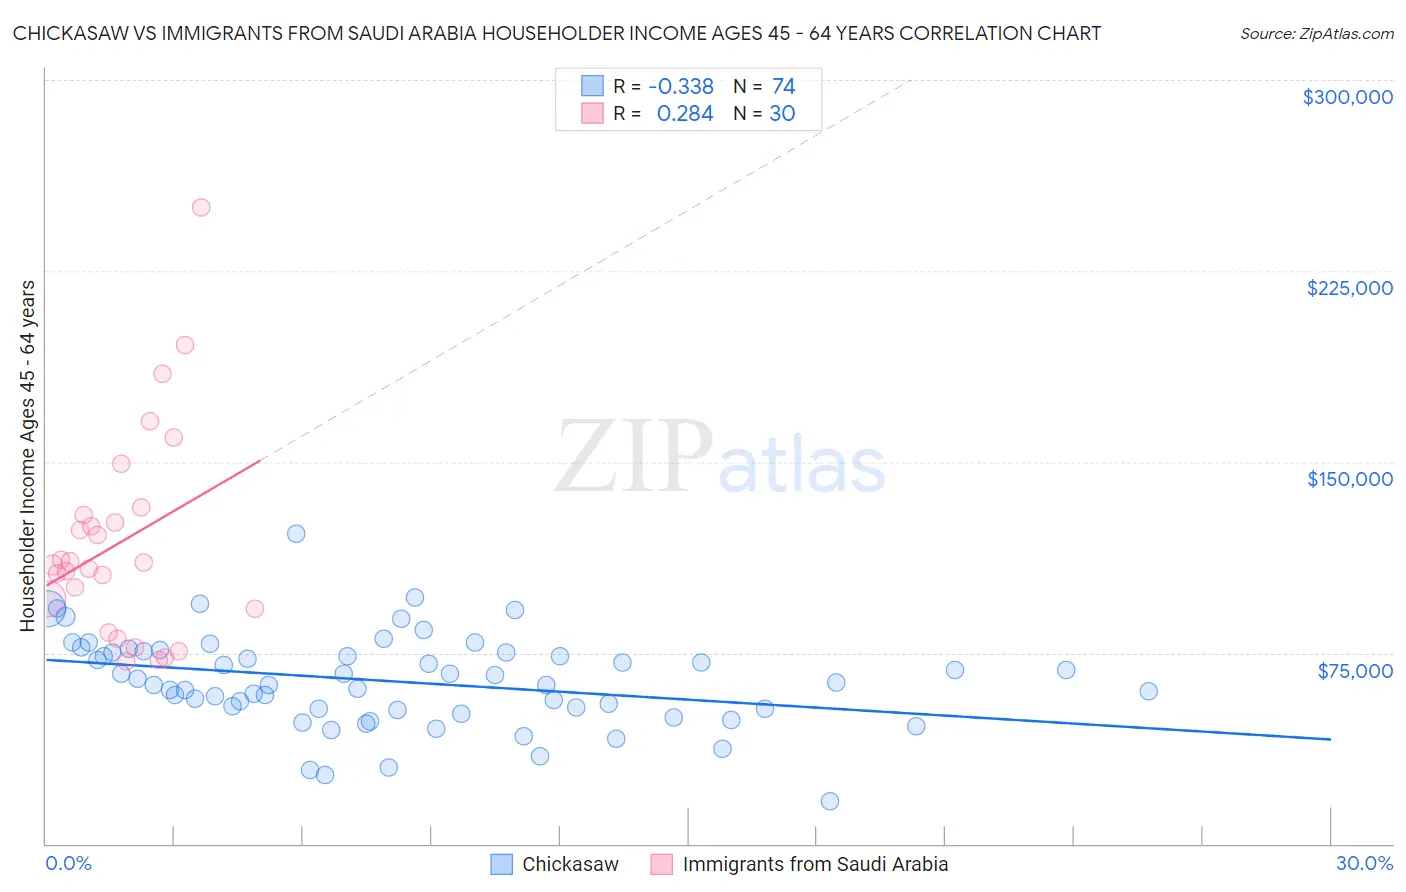
Chickasaw vs Immigrants from Saudi Arabia Householder Income Ages 45 - 64 years Correlation Chart
The statistical analysis conducted on geographies consisting of 147,555,811 people shows a mild negative correlation between the proportion of Chickasaw and household income with householder between the ages 45 and 64 in the United States with a correlation coefficient (R) of -0.338 and weighted average of $82,193. Similarly, the statistical analysis conducted on geographies consisting of 164,122,820 people shows a weak positive correlation between the proportion of Immigrants from Saudi Arabia and household income with householder between the ages 45 and 64 in the United States with a correlation coefficient (R) of 0.284 and weighted average of $105,249, a difference of 28.1%.
Householder Income Ages 45 - 64 years Correlation Summary
| Measurement | Chickasaw | Immigrants from Saudi Arabia |
| Minimum | $16,544 | $71,471 |
| Maximum | $121,667 | $250,001 |
| Range | $105,123 | $178,530 |
| Mean | $63,806 | $118,389 |
| Median | $62,897 | $109,917 |
| Interquartile 25% (IQ1) | $52,874 | $92,091 |
| Interquartile 75% (IQ3) | $75,000 | $128,959 |
| Interquartile Range (IQR) | $22,126 | $36,868 |
| Standard Deviation (Sample) | $18,170 | $40,687 |
| Standard Deviation (Population) | $18,046 | $40,003 |
Similar Demographics by Householder Income Ages 45 - 64 years
Demographics Similar to Chickasaw by Householder Income Ages 45 - 64 years
In terms of householder income ages 45 - 64 years, the demographic groups most similar to Chickasaw are Apache ($82,184, a difference of 0.010%), Yuman ($82,139, a difference of 0.070%), Choctaw ($82,287, a difference of 0.11%), Colville ($82,474, a difference of 0.34%), and Immigrants from Caribbean ($82,513, a difference of 0.39%).
| Demographics | Rating | Rank | Householder Income Ages 45 - 64 years |
| Cajuns | 0.0 /100 | #312 | Tragic $83,015 |
| U.S. Virgin Islanders | 0.0 /100 | #313 | Tragic $82,736 |
| Immigrants | Honduras | 0.0 /100 | #314 | Tragic $82,697 |
| Paiute | 0.0 /100 | #315 | Tragic $82,629 |
| Immigrants | Caribbean | 0.0 /100 | #316 | Tragic $82,513 |
| Colville | 0.0 /100 | #317 | Tragic $82,474 |
| Choctaw | 0.0 /100 | #318 | Tragic $82,287 |
| Chickasaw | 0.0 /100 | #319 | Tragic $82,193 |
| Apache | 0.0 /100 | #320 | Tragic $82,184 |
| Yuman | 0.0 /100 | #321 | Tragic $82,139 |
| Sioux | 0.0 /100 | #322 | Tragic $81,750 |
| Bahamians | 0.0 /100 | #323 | Tragic $81,369 |
| Yup'ik | 0.0 /100 | #324 | Tragic $81,000 |
| Immigrants | Cuba | 0.0 /100 | #325 | Tragic $80,662 |
| Dominicans | 0.0 /100 | #326 | Tragic $80,623 |
Demographics Similar to Immigrants from Saudi Arabia by Householder Income Ages 45 - 64 years
In terms of householder income ages 45 - 64 years, the demographic groups most similar to Immigrants from Saudi Arabia are Pakistani ($105,317, a difference of 0.060%), Portuguese ($105,309, a difference of 0.060%), Native Hawaiian ($105,149, a difference of 0.090%), Immigrants from Northern Africa ($105,430, a difference of 0.17%), and Peruvian ($105,070, a difference of 0.17%).
| Demographics | Rating | Rank | Householder Income Ages 45 - 64 years |
| Immigrants | South Eastern Asia | 94.8 /100 | #120 | Exceptional $106,109 |
| Poles | 94.4 /100 | #121 | Exceptional $105,952 |
| Immigrants | North Macedonia | 94.2 /100 | #122 | Exceptional $105,892 |
| Danes | 93.4 /100 | #123 | Exceptional $105,619 |
| Immigrants | Northern Africa | 92.8 /100 | #124 | Exceptional $105,430 |
| Pakistanis | 92.4 /100 | #125 | Exceptional $105,317 |
| Portuguese | 92.4 /100 | #126 | Exceptional $105,309 |
| Immigrants | Saudi Arabia | 92.2 /100 | #127 | Exceptional $105,249 |
| Native Hawaiians | 91.8 /100 | #128 | Exceptional $105,149 |
| Peruvians | 91.5 /100 | #129 | Exceptional $105,070 |
| Immigrants | Zimbabwe | 91.2 /100 | #130 | Exceptional $104,992 |
| Immigrants | Syria | 90.7 /100 | #131 | Exceptional $104,858 |
| Lebanese | 90.1 /100 | #132 | Exceptional $104,734 |
| Arabs | 89.3 /100 | #133 | Excellent $104,566 |
| Canadians | 89.3 /100 | #134 | Excellent $104,560 |