Portuguese vs Ghanaian Median Female Earnings
COMPARE
Portuguese
Ghanaian
Median Female Earnings
Median Female Earnings Comparison
Portuguese
Ghanaians
$40,177
MEDIAN FEMALE EARNINGS
73.0/ 100
METRIC RATING
157th/ 347
METRIC RANK
$40,429
MEDIAN FEMALE EARNINGS
82.1/ 100
METRIC RATING
146th/ 347
METRIC RANK
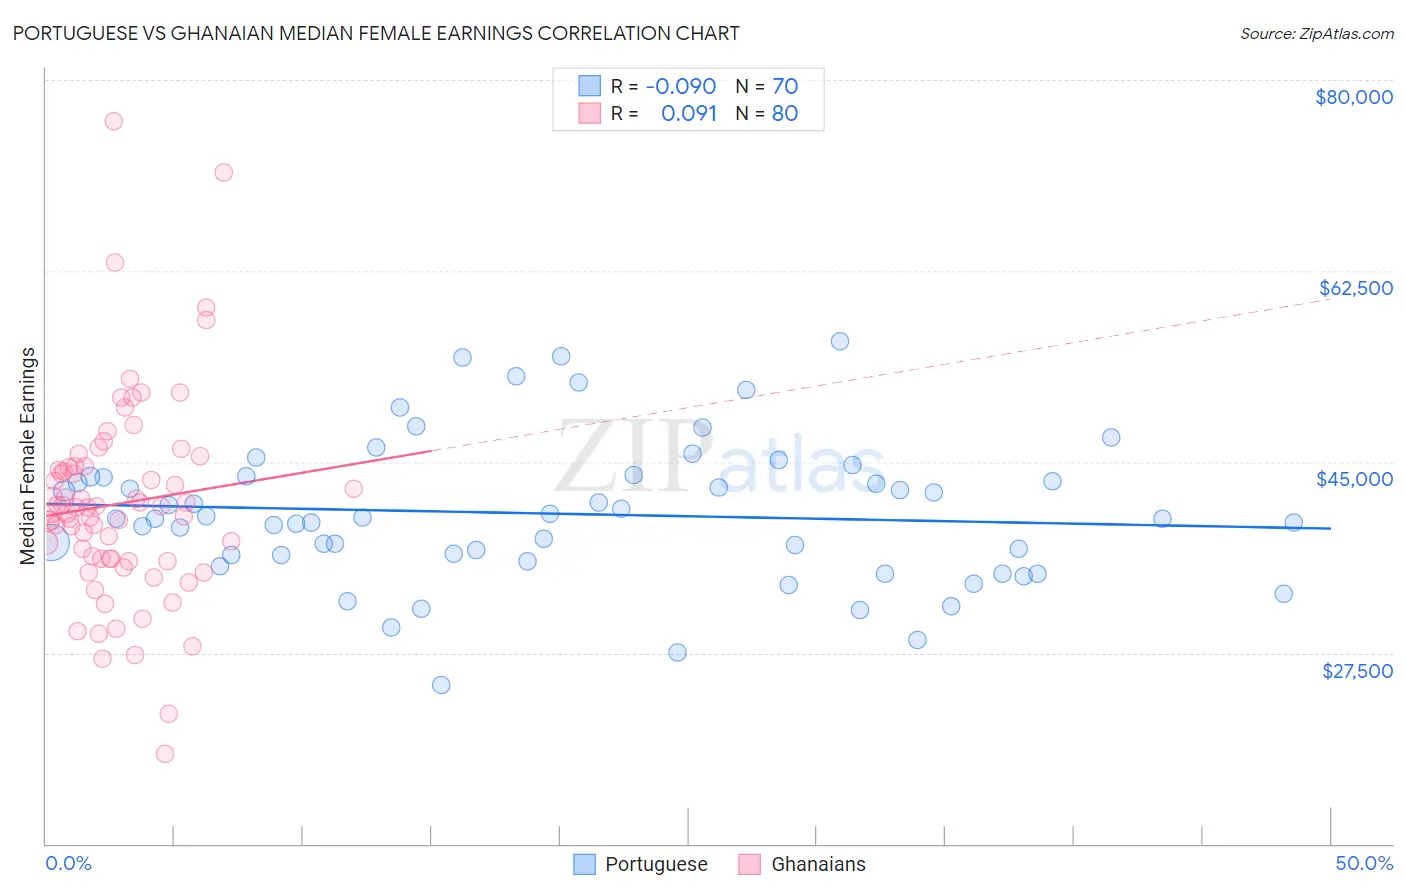
Portuguese vs Ghanaian Median Female Earnings Correlation Chart
The statistical analysis conducted on geographies consisting of 449,940,574 people shows a slight negative correlation between the proportion of Portuguese and median female earnings in the United States with a correlation coefficient (R) of -0.090 and weighted average of $40,177. Similarly, the statistical analysis conducted on geographies consisting of 190,707,731 people shows a slight positive correlation between the proportion of Ghanaians and median female earnings in the United States with a correlation coefficient (R) of 0.091 and weighted average of $40,429, a difference of 0.63%.
Median Female Earnings Correlation Summary
| Measurement | Portuguese | Ghanaian |
| Minimum | $24,606 | $18,266 |
| Maximum | $56,053 | $76,246 |
| Range | $31,447 | $57,980 |
| Mean | $40,249 | $41,171 |
| Median | $39,749 | $40,828 |
| Interquartile 25% (IQ1) | $36,452 | $36,123 |
| Interquartile 75% (IQ3) | $43,632 | $44,535 |
| Interquartile Range (IQR) | $7,179 | $8,413 |
| Standard Deviation (Sample) | $6,533 | $9,292 |
| Standard Deviation (Population) | $6,486 | $9,234 |
Demographics Similar to Portuguese and Ghanaians by Median Female Earnings
In terms of median female earnings, the demographic groups most similar to Portuguese are Immigrants from Senegal ($40,157, a difference of 0.050%), Immigrants from Vietnam ($40,153, a difference of 0.060%), Peruvian ($40,234, a difference of 0.14%), Immigrants from Africa ($40,257, a difference of 0.20%), and Inupiat ($40,080, a difference of 0.24%). Similarly, the demographic groups most similar to Ghanaians are Brazilian ($40,483, a difference of 0.13%), Vietnamese ($40,377, a difference of 0.13%), Northern European ($40,491, a difference of 0.15%), Immigrants from North Macedonia ($40,488, a difference of 0.15%), and Polish ($40,371, a difference of 0.15%).
| Demographics | Rating | Rank | Median Female Earnings |
| Immigrants | Syria | 84.1 /100 | #141 | Excellent $40,499 |
| Sri Lankans | 84.0 /100 | #142 | Excellent $40,496 |
| Northern Europeans | 83.9 /100 | #143 | Excellent $40,491 |
| Immigrants | North Macedonia | 83.8 /100 | #144 | Excellent $40,488 |
| Brazilians | 83.6 /100 | #145 | Excellent $40,483 |
| Ghanaians | 82.1 /100 | #146 | Excellent $40,429 |
| Vietnamese | 80.4 /100 | #147 | Excellent $40,377 |
| Poles | 80.2 /100 | #148 | Excellent $40,371 |
| Immigrants | Cameroon | 79.7 /100 | #149 | Good $40,354 |
| Immigrants | Chile | 79.6 /100 | #150 | Good $40,353 |
| Immigrants | Armenia | 79.2 /100 | #151 | Good $40,340 |
| West Indians | 78.4 /100 | #152 | Good $40,317 |
| British West Indians | 77.7 /100 | #153 | Good $40,299 |
| Immigrants | Oceania | 77.6 /100 | #154 | Good $40,297 |
| Immigrants | Africa | 76.2 /100 | #155 | Good $40,257 |
| Peruvians | 75.3 /100 | #156 | Good $40,234 |
| Portuguese | 73.0 /100 | #157 | Good $40,177 |
| Immigrants | Senegal | 72.2 /100 | #158 | Good $40,157 |
| Immigrants | Vietnam | 72.0 /100 | #159 | Good $40,153 |
| Inupiat | 68.9 /100 | #160 | Good $40,080 |
| Alsatians | 68.0 /100 | #161 | Good $40,060 |