Sierra Leonean vs Venezuelan Median Female Earnings
COMPARE
Sierra Leonean
Venezuelan
Median Female Earnings
Median Female Earnings Comparison
Sierra Leoneans
Venezuelans
$42,868
MEDIAN FEMALE EARNINGS
99.9/ 100
METRIC RATING
65th/ 347
METRIC RANK
$37,282
MEDIAN FEMALE EARNINGS
0.7/ 100
METRIC RATING
262nd/ 347
METRIC RANK
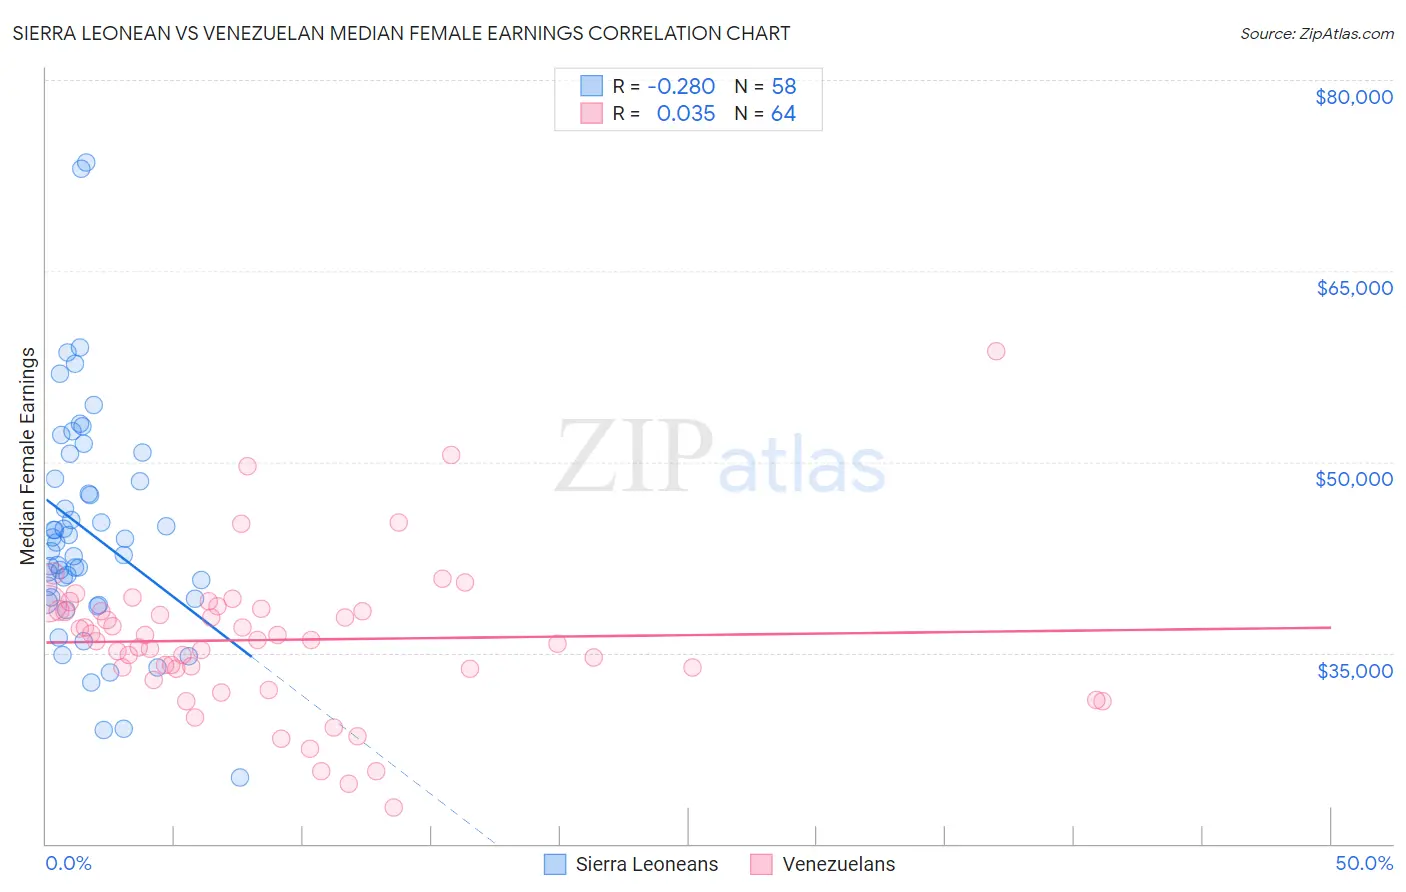
Sierra Leonean vs Venezuelan Median Female Earnings Correlation Chart
The statistical analysis conducted on geographies consisting of 83,345,835 people shows a weak negative correlation between the proportion of Sierra Leoneans and median female earnings in the United States with a correlation coefficient (R) of -0.280 and weighted average of $42,868. Similarly, the statistical analysis conducted on geographies consisting of 306,258,851 people shows no correlation between the proportion of Venezuelans and median female earnings in the United States with a correlation coefficient (R) of 0.035 and weighted average of $37,282, a difference of 15.0%.
Median Female Earnings Correlation Summary
| Measurement | Sierra Leonean | Venezuelan |
| Minimum | $25,167 | $22,864 |
| Maximum | $73,523 | $58,709 |
| Range | $48,356 | $35,845 |
| Mean | $44,483 | $36,013 |
| Median | $43,304 | $36,008 |
| Interquartile 25% (IQ1) | $39,290 | $33,765 |
| Interquartile 75% (IQ3) | $48,705 | $38,398 |
| Interquartile Range (IQR) | $9,415 | $4,633 |
| Standard Deviation (Sample) | $9,174 | $5,910 |
| Standard Deviation (Population) | $9,094 | $5,863 |
Similar Demographics by Median Female Earnings
Demographics Similar to Sierra Leoneans by Median Female Earnings
In terms of median female earnings, the demographic groups most similar to Sierra Leoneans are Immigrants from Norway ($42,837, a difference of 0.070%), Immigrants from Egypt ($42,837, a difference of 0.070%), Immigrants from Austria ($42,824, a difference of 0.10%), Immigrants from Spain ($42,815, a difference of 0.12%), and Immigrants from Ethiopia ($42,744, a difference of 0.29%).
| Demographics | Rating | Rank | Median Female Earnings |
| Paraguayans | 99.9 /100 | #58 | Exceptional $43,173 |
| Estonians | 99.9 /100 | #59 | Exceptional $43,106 |
| Immigrants | Latvia | 99.9 /100 | #60 | Exceptional $43,099 |
| Immigrants | Bulgaria | 99.9 /100 | #61 | Exceptional $43,085 |
| Afghans | 99.9 /100 | #62 | Exceptional $43,077 |
| Immigrants | Ukraine | 99.9 /100 | #63 | Exceptional $43,069 |
| Immigrants | Pakistan | 99.9 /100 | #64 | Exceptional $43,052 |
| Sierra Leoneans | 99.9 /100 | #65 | Exceptional $42,868 |
| Immigrants | Norway | 99.9 /100 | #66 | Exceptional $42,837 |
| Immigrants | Egypt | 99.9 /100 | #67 | Exceptional $42,837 |
| Immigrants | Austria | 99.8 /100 | #68 | Exceptional $42,824 |
| Immigrants | Spain | 99.8 /100 | #69 | Exceptional $42,815 |
| Immigrants | Ethiopia | 99.8 /100 | #70 | Exceptional $42,744 |
| Immigrants | Romania | 99.8 /100 | #71 | Exceptional $42,718 |
| Albanians | 99.8 /100 | #72 | Exceptional $42,584 |
Demographics Similar to Venezuelans by Median Female Earnings
In terms of median female earnings, the demographic groups most similar to Venezuelans are Malaysian ($37,298, a difference of 0.040%), Dutch ($37,339, a difference of 0.15%), Scotch-Irish ($37,383, a difference of 0.27%), Belizean ($37,429, a difference of 0.39%), and German Russian ($37,105, a difference of 0.48%).
| Demographics | Rating | Rank | Median Female Earnings |
| Colville | 1.1 /100 | #255 | Tragic $37,514 |
| Samoans | 1.0 /100 | #256 | Tragic $37,498 |
| Hawaiians | 1.0 /100 | #257 | Tragic $37,497 |
| Belizeans | 0.9 /100 | #258 | Tragic $37,429 |
| Scotch-Irish | 0.8 /100 | #259 | Tragic $37,383 |
| Dutch | 0.7 /100 | #260 | Tragic $37,339 |
| Malaysians | 0.7 /100 | #261 | Tragic $37,298 |
| Venezuelans | 0.7 /100 | #262 | Tragic $37,282 |
| German Russians | 0.5 /100 | #263 | Tragic $37,105 |
| Salvadorans | 0.4 /100 | #264 | Tragic $37,083 |
| Immigrants | Belize | 0.4 /100 | #265 | Tragic $37,056 |
| Dominicans | 0.4 /100 | #266 | Tragic $37,046 |
| Immigrants | Nonimmigrants | 0.4 /100 | #267 | Tragic $37,024 |
| Cree | 0.4 /100 | #268 | Tragic $37,018 |
| Immigrants | Venezuela | 0.4 /100 | #269 | Tragic $37,003 |