Cheyenne vs Peruvian Median Household Income
COMPARE
Cheyenne
Peruvian
Median Household Income
Median Household Income Comparison
Cheyenne
Peruvians
$66,974
MEDIAN HOUSEHOLD INCOME
0.0/ 100
METRIC RATING
335th/ 347
METRIC RANK
$90,261
MEDIAN HOUSEHOLD INCOME
96.5/ 100
METRIC RATING
113th/ 347
METRIC RANK
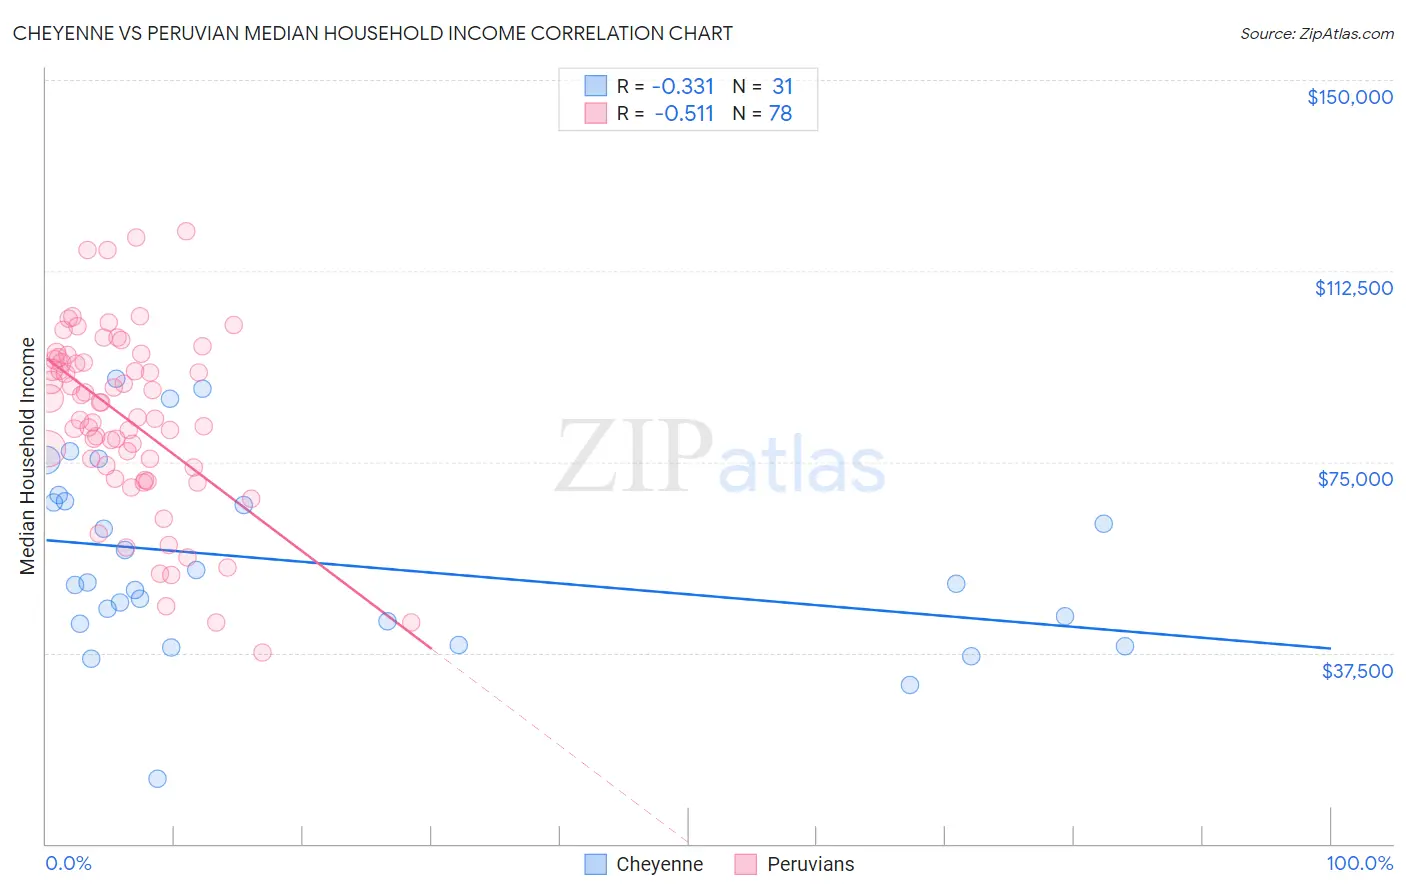
Cheyenne vs Peruvian Median Household Income Correlation Chart
The statistical analysis conducted on geographies consisting of 80,700,473 people shows a mild negative correlation between the proportion of Cheyenne and median household income in the United States with a correlation coefficient (R) of -0.331 and weighted average of $66,974. Similarly, the statistical analysis conducted on geographies consisting of 362,893,410 people shows a substantial negative correlation between the proportion of Peruvians and median household income in the United States with a correlation coefficient (R) of -0.511 and weighted average of $90,261, a difference of 34.8%.
Median Household Income Correlation Summary
| Measurement | Cheyenne | Peruvian |
| Minimum | $12,708 | $37,557 |
| Maximum | $91,250 | $120,179 |
| Range | $78,542 | $82,622 |
| Mean | $55,202 | $83,404 |
| Median | $51,125 | $85,145 |
| Interquartile 25% (IQ1) | $43,228 | $73,839 |
| Interquartile 75% (IQ3) | $67,262 | $95,038 |
| Interquartile Range (IQR) | $24,034 | $21,199 |
| Standard Deviation (Sample) | $18,300 | $17,709 |
| Standard Deviation (Population) | $18,003 | $17,595 |
Similar Demographics by Median Household Income
Demographics Similar to Cheyenne by Median Household Income
In terms of median household income, the demographic groups most similar to Cheyenne are Immigrants from Congo ($66,768, a difference of 0.31%), Black/African American ($67,573, a difference of 0.89%), Creek ($67,715, a difference of 1.1%), Sioux ($67,792, a difference of 1.2%), and Native/Alaskan ($67,879, a difference of 1.3%).
| Demographics | Rating | Rank | Median Household Income |
| Menominee | 0.0 /100 | #328 | Tragic $68,423 |
| Dutch West Indians | 0.0 /100 | #329 | Tragic $68,412 |
| Arapaho | 0.0 /100 | #330 | Tragic $67,965 |
| Natives/Alaskans | 0.0 /100 | #331 | Tragic $67,879 |
| Sioux | 0.0 /100 | #332 | Tragic $67,792 |
| Creek | 0.0 /100 | #333 | Tragic $67,715 |
| Blacks/African Americans | 0.0 /100 | #334 | Tragic $67,573 |
| Cheyenne | 0.0 /100 | #335 | Tragic $66,974 |
| Immigrants | Congo | 0.0 /100 | #336 | Tragic $66,768 |
| Kiowa | 0.0 /100 | #337 | Tragic $65,914 |
| Immigrants | Yemen | 0.0 /100 | #338 | Tragic $65,194 |
| Hopi | 0.0 /100 | #339 | Tragic $65,043 |
| Pueblo | 0.0 /100 | #340 | Tragic $64,692 |
| Crow | 0.0 /100 | #341 | Tragic $63,681 |
| Pima | 0.0 /100 | #342 | Tragic $63,262 |
Demographics Similar to Peruvians by Median Household Income
In terms of median household income, the demographic groups most similar to Peruvians are Northern European ($90,446, a difference of 0.20%), Immigrants from Northern Africa ($90,026, a difference of 0.26%), Immigrants from Western Asia ($90,005, a difference of 0.28%), Immigrants from Poland ($90,549, a difference of 0.32%), and Palestinian ($90,574, a difference of 0.35%).
| Demographics | Rating | Rank | Median Household Income |
| Macedonians | 97.4 /100 | #106 | Exceptional $90,761 |
| Croatians | 97.3 /100 | #107 | Exceptional $90,685 |
| Zimbabweans | 97.2 /100 | #108 | Exceptional $90,618 |
| Chileans | 97.2 /100 | #109 | Exceptional $90,605 |
| Palestinians | 97.1 /100 | #110 | Exceptional $90,574 |
| Immigrants | Poland | 97.1 /100 | #111 | Exceptional $90,549 |
| Northern Europeans | 96.9 /100 | #112 | Exceptional $90,446 |
| Peruvians | 96.5 /100 | #113 | Exceptional $90,261 |
| Immigrants | Northern Africa | 95.9 /100 | #114 | Exceptional $90,026 |
| Immigrants | Western Asia | 95.9 /100 | #115 | Exceptional $90,005 |
| Native Hawaiians | 95.7 /100 | #116 | Exceptional $89,919 |
| Taiwanese | 95.6 /100 | #117 | Exceptional $89,900 |
| Syrians | 95.4 /100 | #118 | Exceptional $89,830 |
| Albanians | 95.2 /100 | #119 | Exceptional $89,744 |
| Immigrants | North Macedonia | 95.2 /100 | #120 | Exceptional $89,741 |