Immigrants from El Salvador vs Native Hawaiian Median Family Income
COMPARE
Immigrants from El Salvador
Native Hawaiian
Median Family Income
Median Family Income Comparison
Immigrants from El Salvador
Native Hawaiians
$92,545
MEDIAN FAMILY INCOME
0.6/ 100
METRIC RATING
252nd/ 347
METRIC RANK
$104,910
MEDIAN FAMILY INCOME
75.8/ 100
METRIC RATING
155th/ 347
METRIC RANK
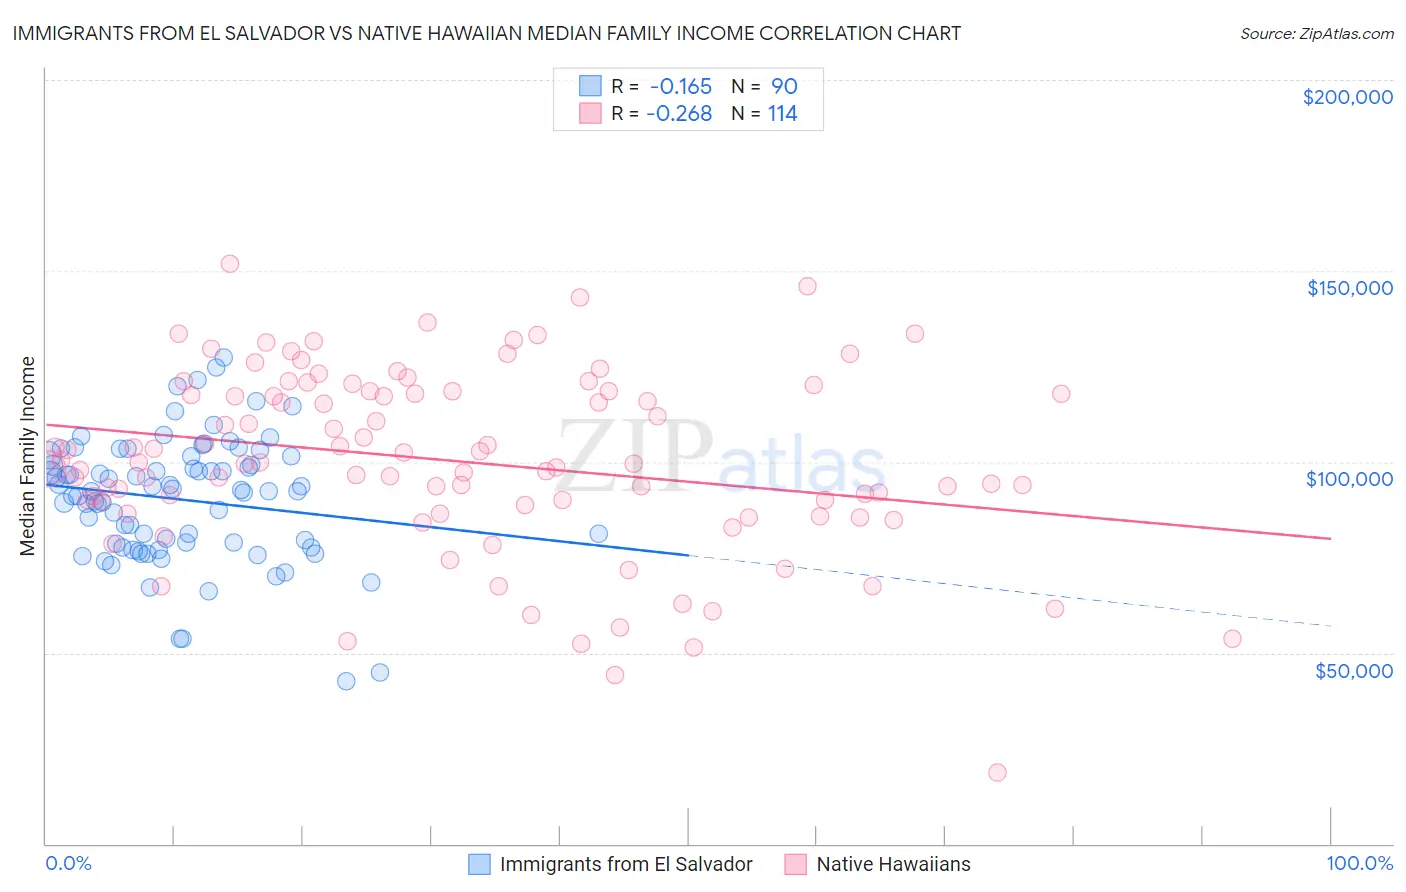
Immigrants from El Salvador vs Native Hawaiian Median Family Income Correlation Chart
The statistical analysis conducted on geographies consisting of 357,645,519 people shows a poor negative correlation between the proportion of Immigrants from El Salvador and median family income in the United States with a correlation coefficient (R) of -0.165 and weighted average of $92,545. Similarly, the statistical analysis conducted on geographies consisting of 331,783,011 people shows a weak negative correlation between the proportion of Native Hawaiians and median family income in the United States with a correlation coefficient (R) of -0.268 and weighted average of $104,910, a difference of 13.4%.
Median Family Income Correlation Summary
| Measurement | Immigrants from El Salvador | Native Hawaiian |
| Minimum | $42,420 | $18,796 |
| Maximum | $127,446 | $151,740 |
| Range | $85,026 | $132,944 |
| Mean | $90,153 | $100,179 |
| Median | $92,338 | $99,798 |
| Interquartile 25% (IQ1) | $78,680 | $88,761 |
| Interquartile 75% (IQ3) | $101,462 | $118,333 |
| Interquartile Range (IQR) | $22,782 | $29,572 |
| Standard Deviation (Sample) | $16,234 | $23,926 |
| Standard Deviation (Population) | $16,143 | $23,821 |
Similar Demographics by Median Family Income
Demographics Similar to Immigrants from El Salvador by Median Family Income
In terms of median family income, the demographic groups most similar to Immigrants from El Salvador are Immigrants from Guyana ($92,513, a difference of 0.030%), Immigrants from Somalia ($92,609, a difference of 0.070%), Immigrants from Barbados ($92,419, a difference of 0.14%), West Indian ($92,765, a difference of 0.24%), and Immigrants from Ecuador ($92,837, a difference of 0.32%).
| Demographics | Rating | Rank | Median Family Income |
| Immigrants | Middle Africa | 1.0 /100 | #245 | Tragic $93,593 |
| Guyanese | 0.9 /100 | #246 | Tragic $93,373 |
| Immigrants | Senegal | 0.7 /100 | #247 | Tragic $92,912 |
| French American Indians | 0.7 /100 | #248 | Tragic $92,872 |
| Immigrants | Ecuador | 0.7 /100 | #249 | Tragic $92,837 |
| West Indians | 0.6 /100 | #250 | Tragic $92,765 |
| Immigrants | Somalia | 0.6 /100 | #251 | Tragic $92,609 |
| Immigrants | El Salvador | 0.6 /100 | #252 | Tragic $92,545 |
| Immigrants | Guyana | 0.6 /100 | #253 | Tragic $92,513 |
| Immigrants | Barbados | 0.5 /100 | #254 | Tragic $92,419 |
| Immigrants | Laos | 0.5 /100 | #255 | Tragic $92,239 |
| Nicaraguans | 0.5 /100 | #256 | Tragic $92,231 |
| Americans | 0.4 /100 | #257 | Tragic $92,096 |
| Osage | 0.4 /100 | #258 | Tragic $91,926 |
| Cape Verdeans | 0.4 /100 | #259 | Tragic $91,848 |
Demographics Similar to Native Hawaiians by Median Family Income
In terms of median family income, the demographic groups most similar to Native Hawaiians are Immigrants from Nepal ($104,966, a difference of 0.050%), Basque ($104,760, a difference of 0.14%), Slavic ($105,144, a difference of 0.22%), Immigrants from Albania ($105,285, a difference of 0.36%), and Moroccan ($104,488, a difference of 0.40%).
| Demographics | Rating | Rank | Median Family Income |
| Hungarians | 81.7 /100 | #148 | Excellent $105,609 |
| Immigrants | Germany | 80.9 /100 | #149 | Excellent $105,507 |
| Irish | 80.5 /100 | #150 | Excellent $105,453 |
| Peruvians | 80.4 /100 | #151 | Excellent $105,444 |
| Immigrants | Albania | 79.1 /100 | #152 | Good $105,285 |
| Slavs | 77.9 /100 | #153 | Good $105,144 |
| Immigrants | Nepal | 76.3 /100 | #154 | Good $104,966 |
| Native Hawaiians | 75.8 /100 | #155 | Good $104,910 |
| Basques | 74.4 /100 | #156 | Good $104,760 |
| Moroccans | 71.6 /100 | #157 | Good $104,488 |
| Scandinavians | 70.8 /100 | #158 | Good $104,410 |
| Swiss | 70.7 /100 | #159 | Good $104,396 |
| Scottish | 69.5 /100 | #160 | Good $104,288 |
| Icelanders | 69.4 /100 | #161 | Good $104,282 |
| Immigrants | Sierra Leone | 66.2 /100 | #162 | Good $103,990 |