Immigrants from Uganda vs Native Hawaiian Median Family Income
COMPARE
Immigrants from Uganda
Native Hawaiian
Median Family Income
Median Family Income Comparison
Immigrants from Uganda
Native Hawaiians
$106,188
MEDIAN FAMILY INCOME
85.7/ 100
METRIC RATING
137th/ 347
METRIC RANK
$104,910
MEDIAN FAMILY INCOME
75.8/ 100
METRIC RATING
155th/ 347
METRIC RANK
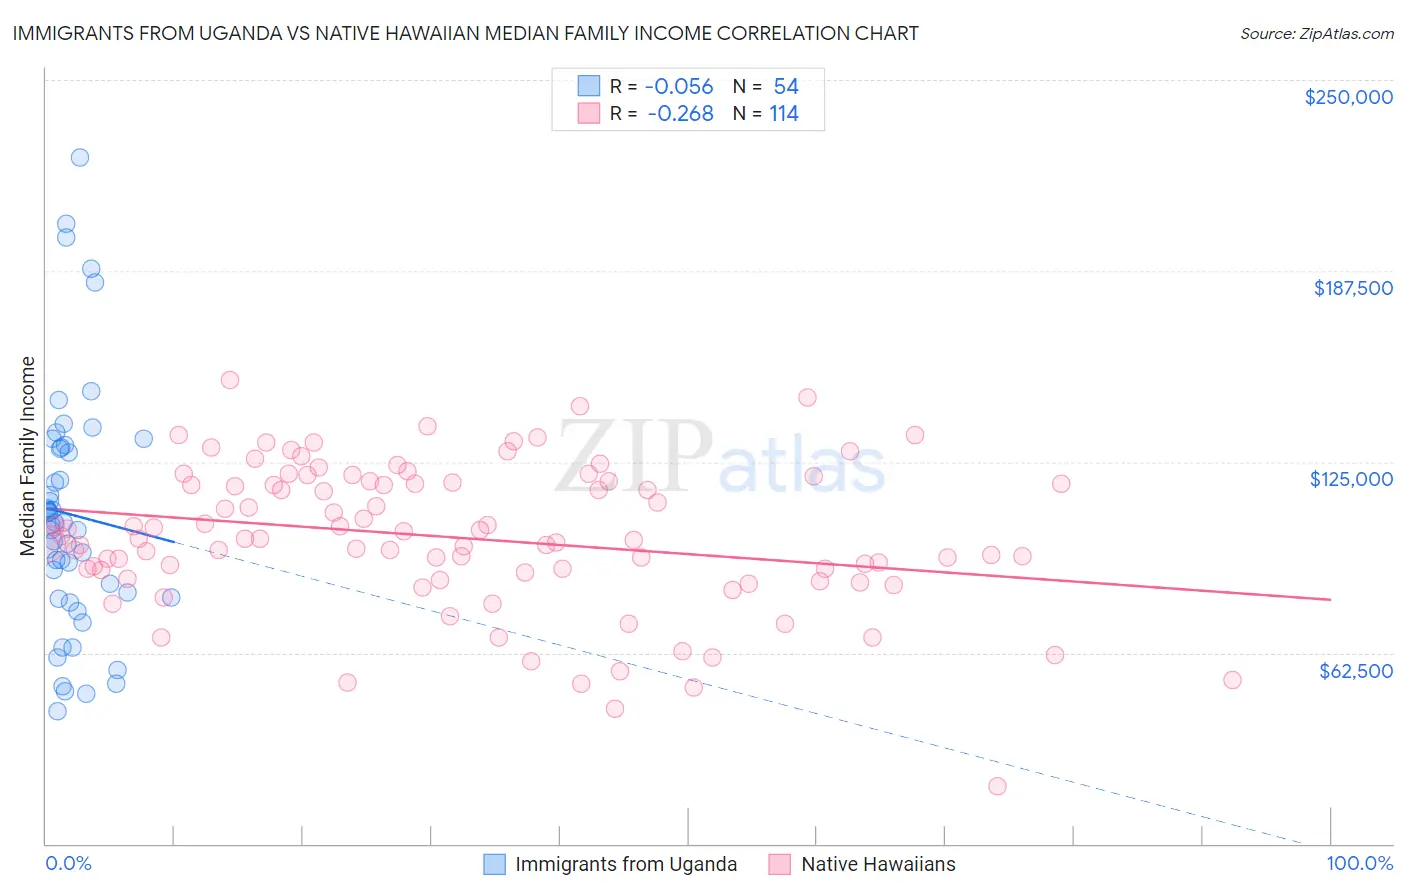
Immigrants from Uganda vs Native Hawaiian Median Family Income Correlation Chart
The statistical analysis conducted on geographies consisting of 125,960,521 people shows a slight negative correlation between the proportion of Immigrants from Uganda and median family income in the United States with a correlation coefficient (R) of -0.056 and weighted average of $106,188. Similarly, the statistical analysis conducted on geographies consisting of 331,783,011 people shows a weak negative correlation between the proportion of Native Hawaiians and median family income in the United States with a correlation coefficient (R) of -0.268 and weighted average of $104,910, a difference of 1.2%.
Median Family Income Correlation Summary
| Measurement | Immigrants from Uganda | Native Hawaiian |
| Minimum | $43,204 | $18,796 |
| Maximum | $224,567 | $151,740 |
| Range | $181,363 | $132,944 |
| Mean | $107,720 | $100,179 |
| Median | $104,727 | $99,798 |
| Interquartile 25% (IQ1) | $80,714 | $88,761 |
| Interquartile 75% (IQ3) | $129,701 | $118,333 |
| Interquartile Range (IQR) | $48,987 | $29,572 |
| Standard Deviation (Sample) | $40,035 | $23,926 |
| Standard Deviation (Population) | $39,663 | $23,821 |
Demographics Similar to Immigrants from Uganda and Native Hawaiians by Median Family Income
In terms of median family income, the demographic groups most similar to Immigrants from Uganda are Immigrants from Vietnam ($106,186, a difference of 0.0%), Luxembourger ($106,183, a difference of 0.0%), Norwegian ($106,144, a difference of 0.040%), Immigrants from South Eastern Asia ($106,252, a difference of 0.060%), and Immigrants from Syria ($106,118, a difference of 0.070%). Similarly, the demographic groups most similar to Native Hawaiians are Immigrants from Nepal ($104,966, a difference of 0.050%), Basque ($104,760, a difference of 0.14%), Slavic ($105,144, a difference of 0.22%), Immigrants from Albania ($105,285, a difference of 0.36%), and Peruvian ($105,444, a difference of 0.51%).
| Demographics | Rating | Rank | Median Family Income |
| Immigrants | South Eastern Asia | 86.1 /100 | #136 | Excellent $106,252 |
| Immigrants | Uganda | 85.7 /100 | #137 | Excellent $106,188 |
| Immigrants | Vietnam | 85.7 /100 | #138 | Excellent $106,186 |
| Luxembourgers | 85.7 /100 | #139 | Excellent $106,183 |
| Norwegians | 85.5 /100 | #140 | Excellent $106,144 |
| Immigrants | Syria | 85.3 /100 | #141 | Excellent $106,118 |
| Slovenes | 84.7 /100 | #142 | Excellent $106,020 |
| Tongans | 84.3 /100 | #143 | Excellent $105,967 |
| Immigrants | Morocco | 84.3 /100 | #144 | Excellent $105,964 |
| Danes | 83.8 /100 | #145 | Excellent $105,900 |
| Czechs | 83.4 /100 | #146 | Excellent $105,839 |
| Immigrants | Chile | 82.1 /100 | #147 | Excellent $105,655 |
| Hungarians | 81.7 /100 | #148 | Excellent $105,609 |
| Immigrants | Germany | 80.9 /100 | #149 | Excellent $105,507 |
| Irish | 80.5 /100 | #150 | Excellent $105,453 |
| Peruvians | 80.4 /100 | #151 | Excellent $105,444 |
| Immigrants | Albania | 79.1 /100 | #152 | Good $105,285 |
| Slavs | 77.9 /100 | #153 | Good $105,144 |
| Immigrants | Nepal | 76.3 /100 | #154 | Good $104,966 |
| Native Hawaiians | 75.8 /100 | #155 | Good $104,910 |
| Basques | 74.4 /100 | #156 | Good $104,760 |