Cape Verdean vs Native Hawaiian Median Family Income
COMPARE
Cape Verdean
Native Hawaiian
Median Family Income
Median Family Income Comparison
Cape Verdeans
Native Hawaiians
$91,848
MEDIAN FAMILY INCOME
0.4/ 100
METRIC RATING
259th/ 347
METRIC RANK
$104,910
MEDIAN FAMILY INCOME
75.8/ 100
METRIC RATING
155th/ 347
METRIC RANK
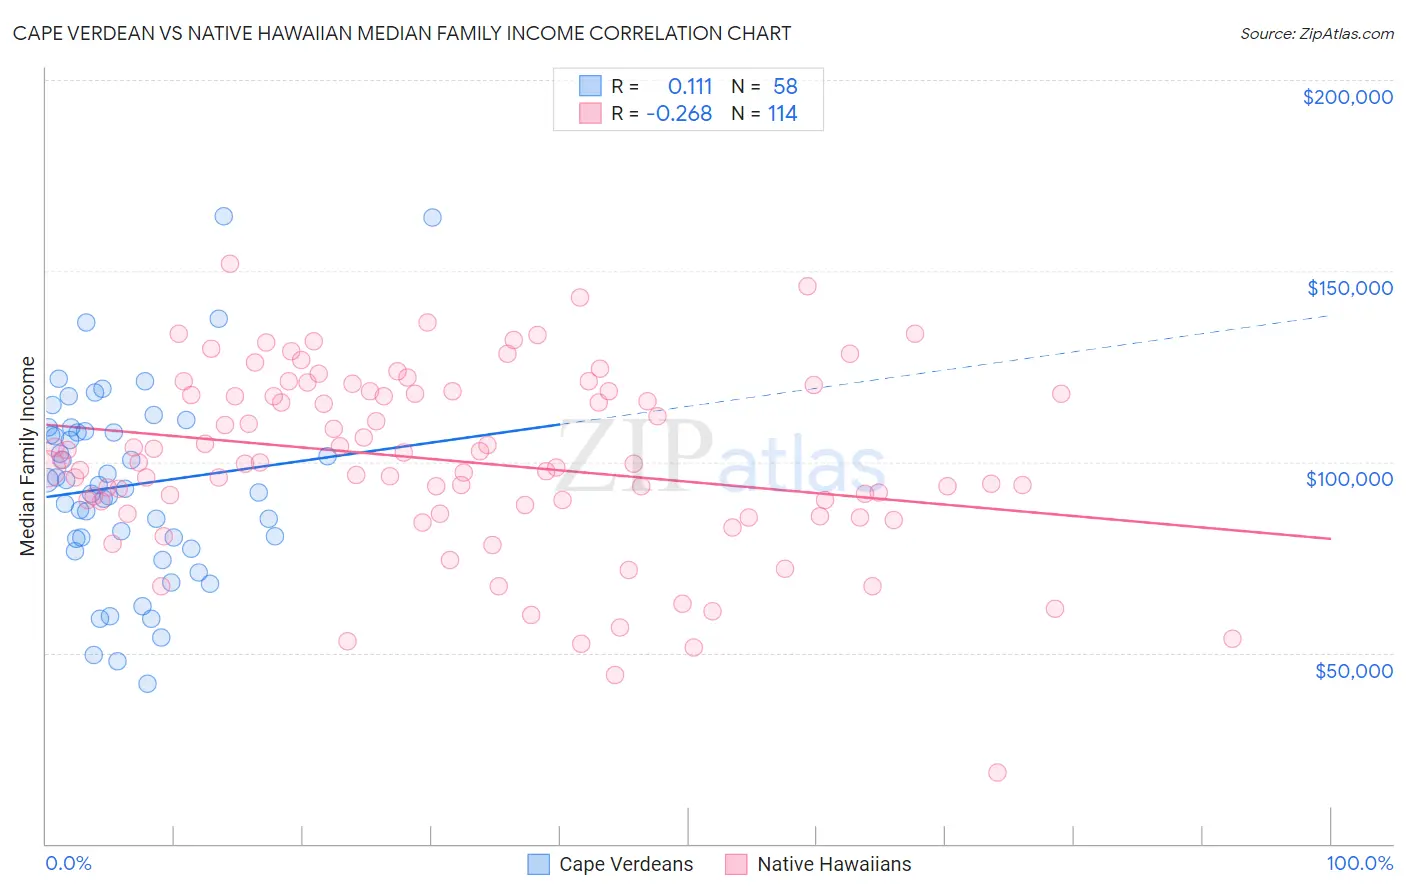
Cape Verdean vs Native Hawaiian Median Family Income Correlation Chart
The statistical analysis conducted on geographies consisting of 107,530,088 people shows a poor positive correlation between the proportion of Cape Verdeans and median family income in the United States with a correlation coefficient (R) of 0.111 and weighted average of $91,848. Similarly, the statistical analysis conducted on geographies consisting of 331,783,011 people shows a weak negative correlation between the proportion of Native Hawaiians and median family income in the United States with a correlation coefficient (R) of -0.268 and weighted average of $104,910, a difference of 14.2%.
Median Family Income Correlation Summary
| Measurement | Cape Verdean | Native Hawaiian |
| Minimum | $41,875 | $18,796 |
| Maximum | $164,351 | $151,740 |
| Range | $122,476 | $132,944 |
| Mean | $93,845 | $100,179 |
| Median | $93,404 | $99,798 |
| Interquartile 25% (IQ1) | $79,783 | $88,761 |
| Interquartile 75% (IQ3) | $107,913 | $118,333 |
| Interquartile Range (IQR) | $28,129 | $29,572 |
| Standard Deviation (Sample) | $25,352 | $23,926 |
| Standard Deviation (Population) | $25,133 | $23,821 |
Similar Demographics by Median Family Income
Demographics Similar to Cape Verdeans by Median Family Income
In terms of median family income, the demographic groups most similar to Cape Verdeans are Osage ($91,926, a difference of 0.090%), Pennsylvania German ($91,763, a difference of 0.090%), Inupiat ($91,730, a difference of 0.13%), Liberian ($91,722, a difference of 0.14%), and American ($92,096, a difference of 0.27%).
| Demographics | Rating | Rank | Median Family Income |
| Immigrants | El Salvador | 0.6 /100 | #252 | Tragic $92,545 |
| Immigrants | Guyana | 0.6 /100 | #253 | Tragic $92,513 |
| Immigrants | Barbados | 0.5 /100 | #254 | Tragic $92,419 |
| Immigrants | Laos | 0.5 /100 | #255 | Tragic $92,239 |
| Nicaraguans | 0.5 /100 | #256 | Tragic $92,231 |
| Americans | 0.4 /100 | #257 | Tragic $92,096 |
| Osage | 0.4 /100 | #258 | Tragic $91,926 |
| Cape Verdeans | 0.4 /100 | #259 | Tragic $91,848 |
| Pennsylvania Germans | 0.4 /100 | #260 | Tragic $91,763 |
| Inupiat | 0.4 /100 | #261 | Tragic $91,730 |
| Liberians | 0.4 /100 | #262 | Tragic $91,722 |
| Immigrants | West Indies | 0.3 /100 | #263 | Tragic $91,588 |
| Senegalese | 0.3 /100 | #264 | Tragic $91,475 |
| Hmong | 0.3 /100 | #265 | Tragic $91,296 |
| Central Americans | 0.3 /100 | #266 | Tragic $91,087 |
Demographics Similar to Native Hawaiians by Median Family Income
In terms of median family income, the demographic groups most similar to Native Hawaiians are Immigrants from Nepal ($104,966, a difference of 0.050%), Basque ($104,760, a difference of 0.14%), Slavic ($105,144, a difference of 0.22%), Immigrants from Albania ($105,285, a difference of 0.36%), and Moroccan ($104,488, a difference of 0.40%).
| Demographics | Rating | Rank | Median Family Income |
| Hungarians | 81.7 /100 | #148 | Excellent $105,609 |
| Immigrants | Germany | 80.9 /100 | #149 | Excellent $105,507 |
| Irish | 80.5 /100 | #150 | Excellent $105,453 |
| Peruvians | 80.4 /100 | #151 | Excellent $105,444 |
| Immigrants | Albania | 79.1 /100 | #152 | Good $105,285 |
| Slavs | 77.9 /100 | #153 | Good $105,144 |
| Immigrants | Nepal | 76.3 /100 | #154 | Good $104,966 |
| Native Hawaiians | 75.8 /100 | #155 | Good $104,910 |
| Basques | 74.4 /100 | #156 | Good $104,760 |
| Moroccans | 71.6 /100 | #157 | Good $104,488 |
| Scandinavians | 70.8 /100 | #158 | Good $104,410 |
| Swiss | 70.7 /100 | #159 | Good $104,396 |
| Scottish | 69.5 /100 | #160 | Good $104,288 |
| Icelanders | 69.4 /100 | #161 | Good $104,282 |
| Immigrants | Sierra Leone | 66.2 /100 | #162 | Good $103,990 |