Immigrants from Brazil vs Immigrants from Kenya Householder Income Over 65 years
COMPARE
Immigrants from Brazil
Immigrants from Kenya
Householder Income Over 65 years
Householder Income Over 65 years Comparison
Immigrants from Brazil
Immigrants from Kenya
$62,364
HOUSEHOLDER INCOME OVER 65 YEARS
81.2/ 100
METRIC RATING
134th/ 347
METRIC RANK
$59,710
HOUSEHOLDER INCOME OVER 65 YEARS
21.1/ 100
METRIC RATING
197th/ 347
METRIC RANK
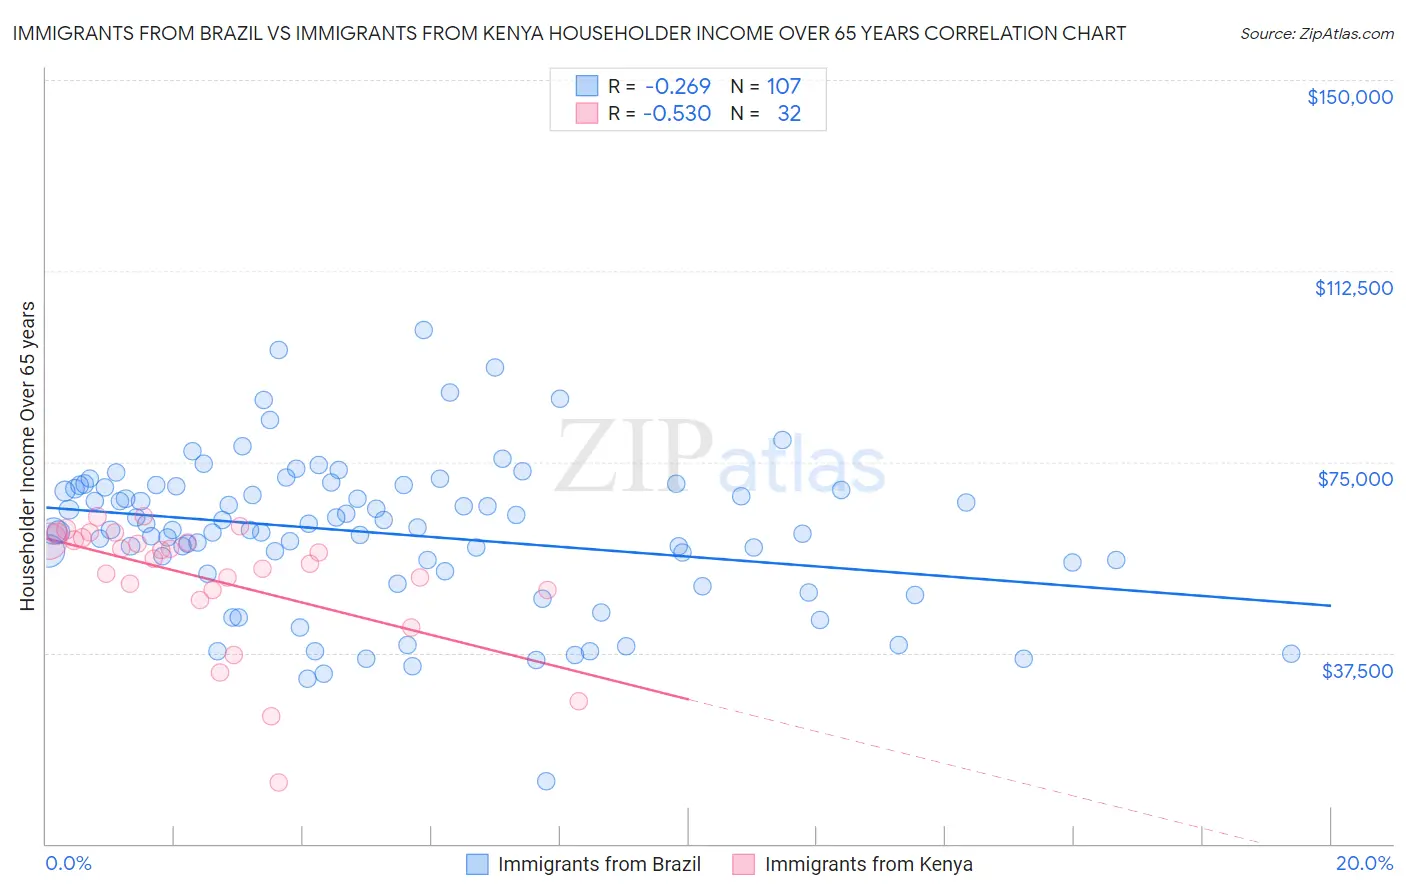
Immigrants from Brazil vs Immigrants from Kenya Householder Income Over 65 years Correlation Chart
The statistical analysis conducted on geographies consisting of 342,081,092 people shows a weak negative correlation between the proportion of Immigrants from Brazil and household income with householder over the age of 65 in the United States with a correlation coefficient (R) of -0.269 and weighted average of $62,364. Similarly, the statistical analysis conducted on geographies consisting of 217,560,107 people shows a substantial negative correlation between the proportion of Immigrants from Kenya and household income with householder over the age of 65 in the United States with a correlation coefficient (R) of -0.530 and weighted average of $59,710, a difference of 4.4%.
Householder Income Over 65 years Correlation Summary
| Measurement | Immigrants from Brazil | Immigrants from Kenya |
| Minimum | $12,293 | $12,049 |
| Maximum | $100,809 | $64,334 |
| Range | $88,516 | $52,285 |
| Mean | $60,924 | $51,985 |
| Median | $61,677 | $56,685 |
| Interquartile 25% (IQ1) | $53,466 | $49,767 |
| Interquartile 75% (IQ3) | $70,121 | $59,847 |
| Interquartile Range (IQR) | $16,655 | $10,080 |
| Standard Deviation (Sample) | $14,904 | $12,400 |
| Standard Deviation (Population) | $14,834 | $12,205 |
Similar Demographics by Householder Income Over 65 years
Demographics Similar to Immigrants from Brazil by Householder Income Over 65 years
In terms of householder income over 65 years, the demographic groups most similar to Immigrants from Brazil are Immigrants from Chile ($62,354, a difference of 0.020%), Alaskan Athabascan ($62,330, a difference of 0.060%), Immigrants from Syria ($62,303, a difference of 0.10%), Immigrants from Kazakhstan ($62,292, a difference of 0.12%), and Lebanese ($62,287, a difference of 0.12%).
| Demographics | Rating | Rank | Householder Income Over 65 years |
| Swedes | 86.4 /100 | #127 | Excellent $62,736 |
| Aleuts | 86.1 /100 | #128 | Excellent $62,708 |
| Immigrants | Eastern Europe | 85.9 /100 | #129 | Excellent $62,693 |
| Basques | 85.4 /100 | #130 | Excellent $62,653 |
| Immigrants | Western Asia | 85.3 /100 | #131 | Excellent $62,645 |
| Immigrants | Germany | 83.9 /100 | #132 | Excellent $62,544 |
| Immigrants | Northern Africa | 83.6 /100 | #133 | Excellent $62,522 |
| Immigrants | Brazil | 81.2 /100 | #134 | Excellent $62,364 |
| Immigrants | Chile | 81.0 /100 | #135 | Excellent $62,354 |
| Alaskan Athabascans | 80.6 /100 | #136 | Excellent $62,330 |
| Immigrants | Syria | 80.2 /100 | #137 | Excellent $62,303 |
| Immigrants | Kazakhstan | 80.0 /100 | #138 | Excellent $62,292 |
| Lebanese | 79.9 /100 | #139 | Good $62,287 |
| Arabs | 79.6 /100 | #140 | Good $62,266 |
| Canadians | 79.0 /100 | #141 | Good $62,230 |
Demographics Similar to Immigrants from Kenya by Householder Income Over 65 years
In terms of householder income over 65 years, the demographic groups most similar to Immigrants from Kenya are German ($59,730, a difference of 0.030%), Moroccan ($59,683, a difference of 0.040%), Immigrants ($59,656, a difference of 0.090%), French ($59,656, a difference of 0.090%), and Immigrants from Iraq ($59,824, a difference of 0.19%).
| Demographics | Rating | Rank | Householder Income Over 65 years |
| Puget Sound Salish | 25.3 /100 | #190 | Fair $59,934 |
| Belgians | 24.9 /100 | #191 | Fair $59,915 |
| South Americans | 23.8 /100 | #192 | Fair $59,854 |
| Immigrants | Costa Rica | 23.6 /100 | #193 | Fair $59,848 |
| Immigrants | Africa | 23.4 /100 | #194 | Fair $59,837 |
| Immigrants | Iraq | 23.2 /100 | #195 | Fair $59,824 |
| Germans | 21.5 /100 | #196 | Fair $59,730 |
| Immigrants | Kenya | 21.1 /100 | #197 | Fair $59,710 |
| Moroccans | 20.7 /100 | #198 | Fair $59,683 |
| Immigrants | Immigrants | 20.2 /100 | #199 | Fair $59,656 |
| French | 20.2 /100 | #200 | Fair $59,656 |
| Dutch | 18.3 /100 | #201 | Poor $59,539 |
| Finns | 18.2 /100 | #202 | Poor $59,535 |
| Scotch-Irish | 16.9 /100 | #203 | Poor $59,447 |
| Arapaho | 16.0 /100 | #204 | Poor $59,383 |