Central American Indian vs Immigrants from Iraq Per Capita Income
COMPARE
Central American Indian
Immigrants from Iraq
Per Capita Income
Per Capita Income Comparison
Central American Indians
Immigrants from Iraq
$37,699
PER CAPITA INCOME
0.1/ 100
METRIC RATING
286th/ 347
METRIC RANK
$41,365
PER CAPITA INCOME
7.1/ 100
METRIC RATING
222nd/ 347
METRIC RANK
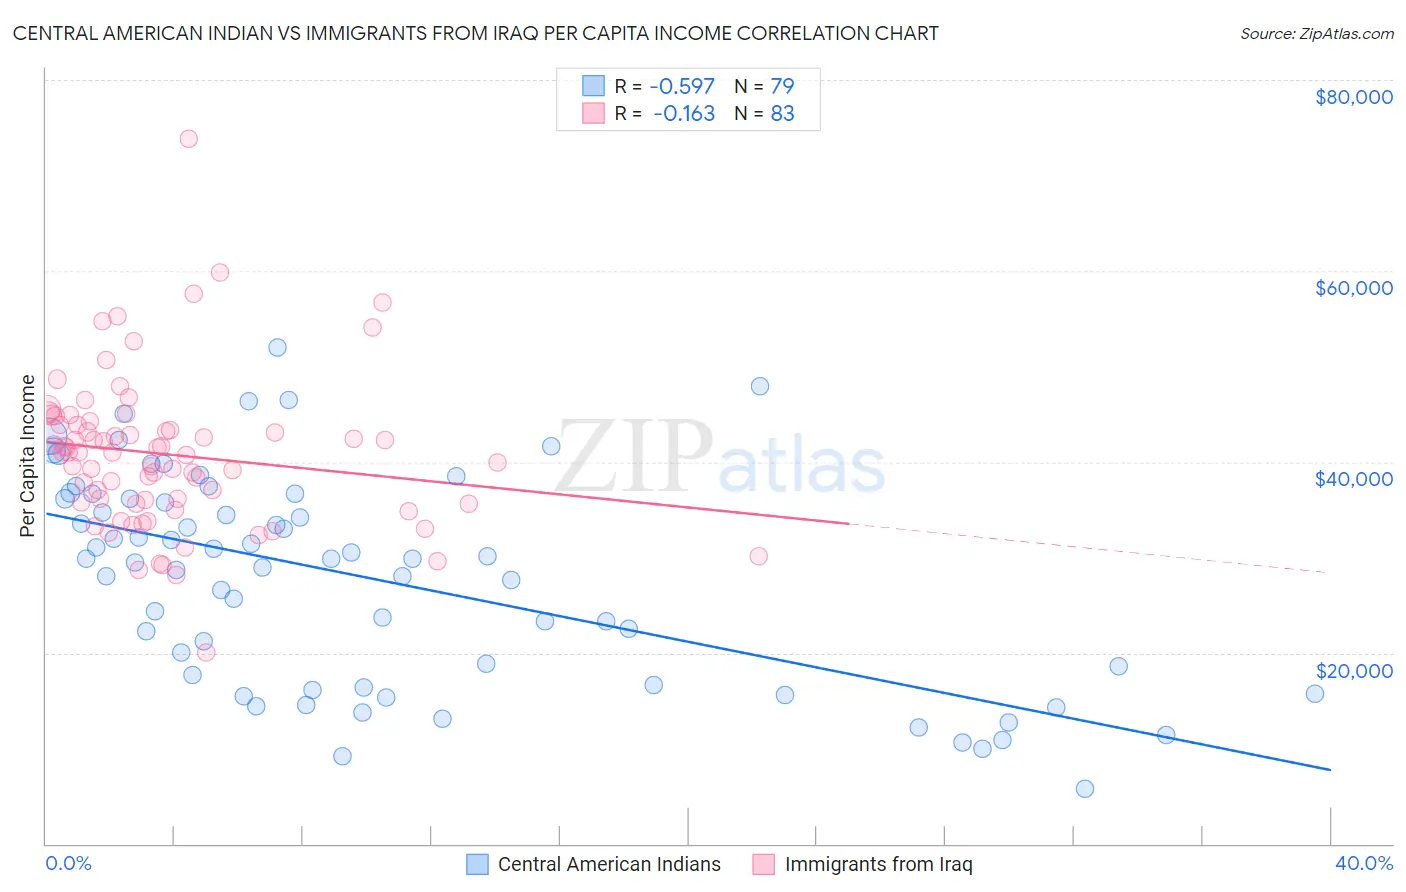
Central American Indian vs Immigrants from Iraq Per Capita Income Correlation Chart
The statistical analysis conducted on geographies consisting of 326,146,034 people shows a substantial negative correlation between the proportion of Central American Indians and per capita income in the United States with a correlation coefficient (R) of -0.597 and weighted average of $37,699. Similarly, the statistical analysis conducted on geographies consisting of 194,781,264 people shows a poor negative correlation between the proportion of Immigrants from Iraq and per capita income in the United States with a correlation coefficient (R) of -0.163 and weighted average of $41,365, a difference of 9.7%.
Per Capita Income Correlation Summary
| Measurement | Central American Indian | Immigrants from Iraq |
| Minimum | $5,814 | $19,973 |
| Maximum | $51,916 | $73,810 |
| Range | $46,102 | $53,837 |
| Mean | $27,773 | $40,767 |
| Median | $29,805 | $40,988 |
| Interquartile 25% (IQ1) | $16,640 | $35,615 |
| Interquartile 75% (IQ3) | $36,169 | $43,922 |
| Interquartile Range (IQR) | $19,529 | $8,307 |
| Standard Deviation (Sample) | $10,964 | $8,068 |
| Standard Deviation (Population) | $10,894 | $8,019 |
Similar Demographics by Per Capita Income
Demographics Similar to Central American Indians by Per Capita Income
In terms of per capita income, the demographic groups most similar to Central American Indians are Dominican ($37,697, a difference of 0.010%), Blackfeet ($37,695, a difference of 0.010%), Guatemalan ($37,766, a difference of 0.18%), African ($37,785, a difference of 0.23%), and U.S. Virgin Islander ($37,589, a difference of 0.29%).
| Demographics | Rating | Rank | Per Capita Income |
| Colville | 0.2 /100 | #279 | Tragic $38,047 |
| Potawatomi | 0.2 /100 | #280 | Tragic $38,046 |
| Immigrants | Dominica | 0.2 /100 | #281 | Tragic $37,952 |
| Immigrants | Laos | 0.1 /100 | #282 | Tragic $37,857 |
| Pennsylvania Germans | 0.1 /100 | #283 | Tragic $37,842 |
| Africans | 0.1 /100 | #284 | Tragic $37,785 |
| Guatemalans | 0.1 /100 | #285 | Tragic $37,766 |
| Central American Indians | 0.1 /100 | #286 | Tragic $37,699 |
| Dominicans | 0.1 /100 | #287 | Tragic $37,697 |
| Blackfeet | 0.1 /100 | #288 | Tragic $37,695 |
| U.S. Virgin Islanders | 0.1 /100 | #289 | Tragic $37,589 |
| Immigrants | Guatemala | 0.1 /100 | #290 | Tragic $37,550 |
| Cajuns | 0.1 /100 | #291 | Tragic $37,527 |
| Immigrants | Micronesia | 0.1 /100 | #292 | Tragic $37,464 |
| Mexican American Indians | 0.1 /100 | #293 | Tragic $37,407 |
Demographics Similar to Immigrants from Iraq by Per Capita Income
In terms of per capita income, the demographic groups most similar to Immigrants from Iraq are Immigrants from Cameroon ($41,334, a difference of 0.070%), Immigrants from St. Vincent and the Grenadines ($41,270, a difference of 0.23%), Immigrants from Barbados ($41,478, a difference of 0.27%), Immigrants from Trinidad and Tobago ($41,476, a difference of 0.27%), and Puget Sound Salish ($41,495, a difference of 0.31%).
| Demographics | Rating | Rank | Per Capita Income |
| Sudanese | 9.9 /100 | #215 | Tragic $41,695 |
| Tongans | 9.9 /100 | #216 | Tragic $41,693 |
| Guamanians/Chamorros | 9.7 /100 | #217 | Tragic $41,678 |
| Trinidadians and Tobagonians | 9.5 /100 | #218 | Tragic $41,655 |
| Puget Sound Salish | 8.1 /100 | #219 | Tragic $41,495 |
| Immigrants | Barbados | 7.9 /100 | #220 | Tragic $41,478 |
| Immigrants | Trinidad and Tobago | 7.9 /100 | #221 | Tragic $41,476 |
| Immigrants | Iraq | 7.1 /100 | #222 | Tragic $41,365 |
| Immigrants | Cameroon | 6.8 /100 | #223 | Tragic $41,334 |
| Immigrants | St. Vincent and the Grenadines | 6.4 /100 | #224 | Tragic $41,270 |
| West Indians | 6.0 /100 | #225 | Tragic $41,217 |
| Immigrants | Ecuador | 5.9 /100 | #226 | Tragic $41,195 |
| Immigrants | Ghana | 5.5 /100 | #227 | Tragic $41,131 |
| Immigrants | Grenada | 5.5 /100 | #228 | Tragic $41,123 |
| Nigerians | 4.9 /100 | #229 | Tragic $41,026 |