Immigrants from Afghanistan vs Immigrants from Western Europe Householder Income Ages 45 - 64 years
COMPARE
Immigrants from Afghanistan
Immigrants from Western Europe
Householder Income Ages 45 - 64 years
Householder Income Ages 45 - 64 years Comparison
Immigrants from Afghanistan
Immigrants from Western Europe
$108,785
HOUSEHOLDER INCOME AGES 45 - 64 YEARS
98.6/ 100
METRIC RATING
85th/ 347
METRIC RANK
$108,824
HOUSEHOLDER INCOME AGES 45 - 64 YEARS
98.6/ 100
METRIC RATING
84th/ 347
METRIC RANK
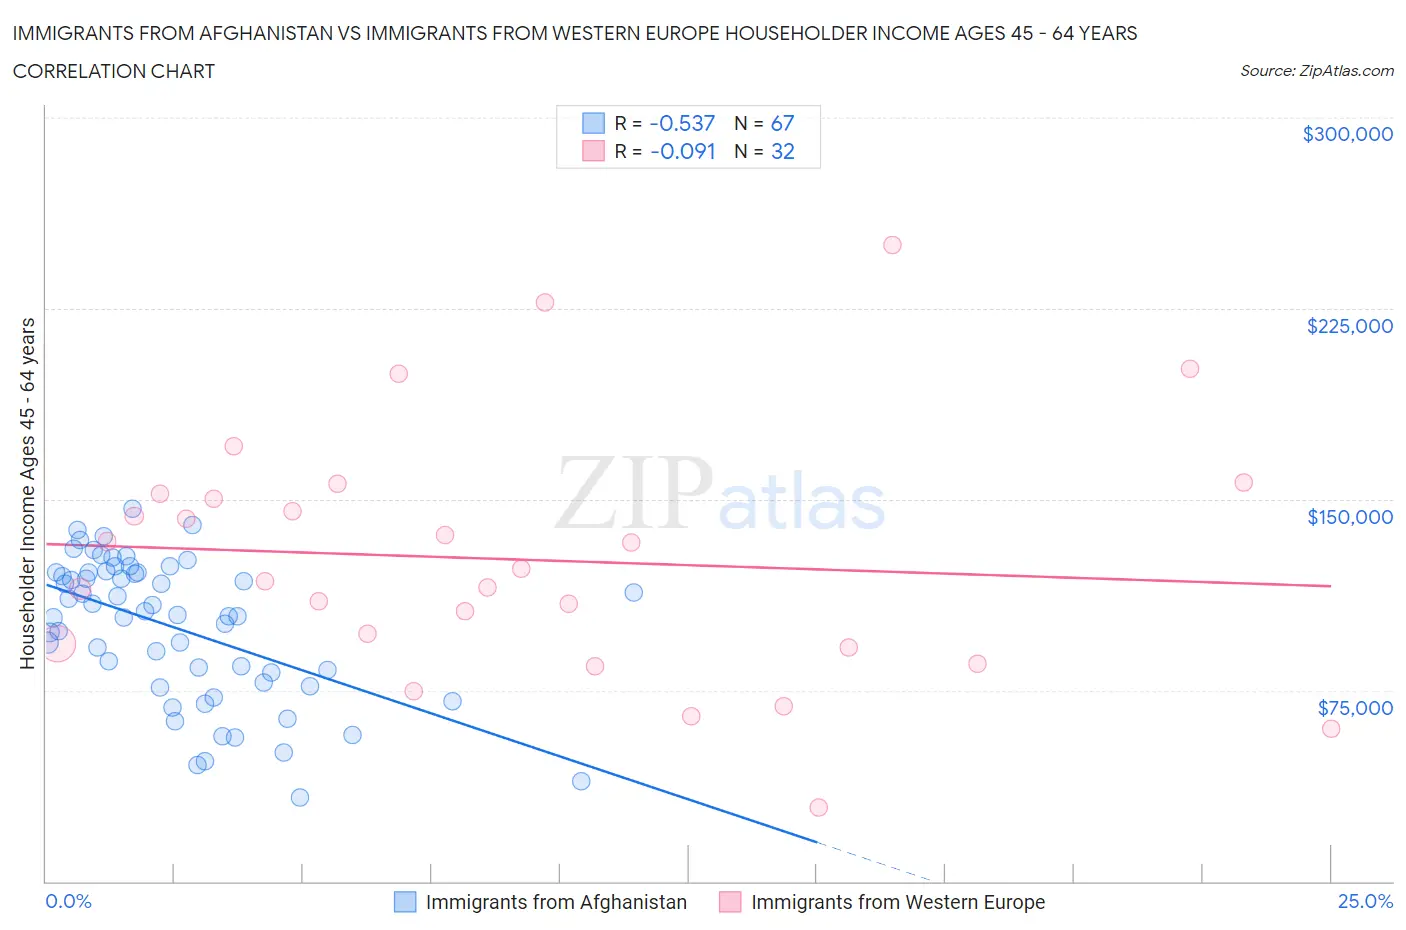
Immigrants from Afghanistan vs Immigrants from Western Europe Householder Income Ages 45 - 64 years Correlation Chart
The statistical analysis conducted on geographies consisting of 147,616,456 people shows a substantial negative correlation between the proportion of Immigrants from Afghanistan and household income with householder between the ages 45 and 64 in the United States with a correlation coefficient (R) of -0.537 and weighted average of $108,785. Similarly, the statistical analysis conducted on geographies consisting of 492,840,606 people shows a slight negative correlation between the proportion of Immigrants from Western Europe and household income with householder between the ages 45 and 64 in the United States with a correlation coefficient (R) of -0.091 and weighted average of $108,824, a difference of 0.040%.
Householder Income Ages 45 - 64 years Correlation Summary
| Measurement | Immigrants from Afghanistan | Immigrants from Western Europe |
| Minimum | $33,125 | $28,859 |
| Maximum | $146,322 | $250,001 |
| Range | $113,197 | $221,142 |
| Mean | $99,596 | $126,348 |
| Median | $104,498 | $120,399 |
| Interquartile 25% (IQ1) | $78,229 | $92,693 |
| Interquartile 75% (IQ3) | $121,219 | $151,414 |
| Interquartile Range (IQR) | $42,990 | $58,721 |
| Standard Deviation (Sample) | $27,771 | $48,876 |
| Standard Deviation (Population) | $27,563 | $48,106 |
Demographics Similar to Immigrants from Afghanistan and Immigrants from Western Europe by Householder Income Ages 45 - 64 years
In terms of householder income ages 45 - 64 years, the demographic groups most similar to Immigrants from Afghanistan are Austrian ($108,692, a difference of 0.090%), Tongan ($108,643, a difference of 0.13%), Romanian ($108,609, a difference of 0.16%), Immigrants from Spain ($109,051, a difference of 0.24%), and Ukrainian ($108,475, a difference of 0.29%). Similarly, the demographic groups most similar to Immigrants from Western Europe are Austrian ($108,692, a difference of 0.12%), Tongan ($108,643, a difference of 0.17%), Romanian ($108,609, a difference of 0.20%), Immigrants from Spain ($109,051, a difference of 0.21%), and Ukrainian ($108,475, a difference of 0.32%).
| Demographics | Rating | Rank | Householder Income Ages 45 - 64 years |
| Immigrants | Egypt | 99.2 /100 | #74 | Exceptional $109,941 |
| South Africans | 99.1 /100 | #75 | Exceptional $109,719 |
| Paraguayans | 99.0 /100 | #76 | Exceptional $109,447 |
| Immigrants | England | 99.0 /100 | #77 | Exceptional $109,446 |
| Immigrants | Canada | 99.0 /100 | #78 | Exceptional $109,402 |
| Immigrants | Bulgaria | 98.9 /100 | #79 | Exceptional $109,379 |
| Jordanians | 98.9 /100 | #80 | Exceptional $109,376 |
| Immigrants | Eastern Europe | 98.9 /100 | #81 | Exceptional $109,335 |
| Immigrants | North America | 98.8 /100 | #82 | Exceptional $109,198 |
| Immigrants | Spain | 98.8 /100 | #83 | Exceptional $109,051 |
| Immigrants | Western Europe | 98.6 /100 | #84 | Exceptional $108,824 |
| Immigrants | Afghanistan | 98.6 /100 | #85 | Exceptional $108,785 |
| Austrians | 98.5 /100 | #86 | Exceptional $108,692 |
| Tongans | 98.5 /100 | #87 | Exceptional $108,643 |
| Romanians | 98.5 /100 | #88 | Exceptional $108,609 |
| Ukrainians | 98.3 /100 | #89 | Exceptional $108,475 |
| Immigrants | Philippines | 98.3 /100 | #90 | Exceptional $108,471 |
| Immigrants | Lebanon | 98.3 /100 | #91 | Exceptional $108,471 |
| Croatians | 98.3 /100 | #92 | Exceptional $108,383 |
| Immigrants | Croatia | 98.2 /100 | #93 | Exceptional $108,304 |
| Sri Lankans | 98.2 /100 | #94 | Exceptional $108,270 |