Immigrants from Oceania vs Immigrants from Singapore Householder Income Under 25 years
COMPARE
Immigrants from Oceania
Immigrants from Singapore
Householder Income Under 25 years
Householder Income Under 25 years Comparison
Immigrants from Oceania
Immigrants from Singapore
$53,680
HOUSEHOLDER INCOME UNDER 25 YEARS
97.5/ 100
METRIC RATING
112th/ 347
METRIC RANK
$56,835
HOUSEHOLDER INCOME UNDER 25 YEARS
100.0/ 100
METRIC RATING
24th/ 347
METRIC RANK
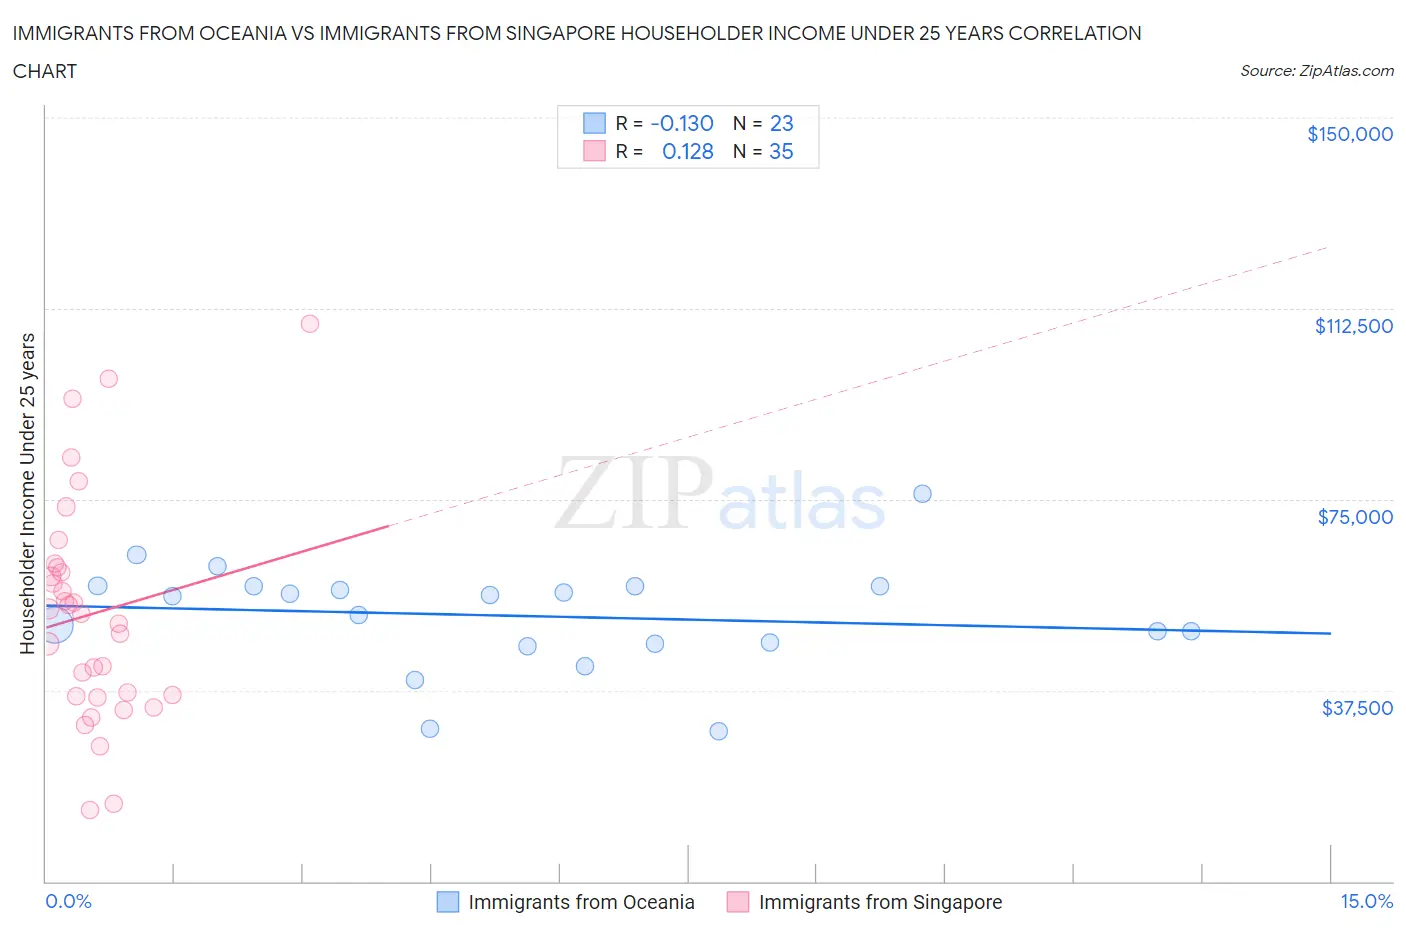
Immigrants from Oceania vs Immigrants from Singapore Householder Income Under 25 years Correlation Chart
The statistical analysis conducted on geographies consisting of 265,057,334 people shows a poor negative correlation between the proportion of Immigrants from Oceania and household income with householder under the age of 25 in the United States with a correlation coefficient (R) of -0.130 and weighted average of $53,680. Similarly, the statistical analysis conducted on geographies consisting of 123,473,430 people shows a poor positive correlation between the proportion of Immigrants from Singapore and household income with householder under the age of 25 in the United States with a correlation coefficient (R) of 0.128 and weighted average of $56,835, a difference of 5.9%.
Householder Income Under 25 years Correlation Summary
| Measurement | Immigrants from Oceania | Immigrants from Singapore |
| Minimum | $29,525 | $14,087 |
| Maximum | $76,023 | $109,471 |
| Range | $46,498 | $95,384 |
| Mean | $52,121 | $52,518 |
| Median | $56,037 | $52,500 |
| Interquartile 25% (IQ1) | $46,716 | $36,250 |
| Interquartile 75% (IQ3) | $58,036 | $61,737 |
| Interquartile Range (IQR) | $11,320 | $25,487 |
| Standard Deviation (Sample) | $10,477 | $21,943 |
| Standard Deviation (Population) | $10,247 | $21,627 |
Similar Demographics by Householder Income Under 25 years
Demographics Similar to Immigrants from Oceania by Householder Income Under 25 years
In terms of householder income under 25 years, the demographic groups most similar to Immigrants from Oceania are Immigrants from Colombia ($53,714, a difference of 0.060%), Greek ($53,715, a difference of 0.070%), Immigrants from Ecuador ($53,722, a difference of 0.080%), Romanian ($53,632, a difference of 0.090%), and Maltese ($53,735, a difference of 0.10%).
| Demographics | Rating | Rank | Householder Income Under 25 years |
| Immigrants | France | 98.1 /100 | #105 | Exceptional $53,805 |
| Albanians | 98.1 /100 | #106 | Exceptional $53,794 |
| Australians | 97.8 /100 | #107 | Exceptional $53,739 |
| Maltese | 97.8 /100 | #108 | Exceptional $53,735 |
| Immigrants | Ecuador | 97.7 /100 | #109 | Exceptional $53,722 |
| Greeks | 97.7 /100 | #110 | Exceptional $53,715 |
| Immigrants | Colombia | 97.7 /100 | #111 | Exceptional $53,714 |
| Immigrants | Oceania | 97.5 /100 | #112 | Exceptional $53,680 |
| Romanians | 97.2 /100 | #113 | Exceptional $53,632 |
| Immigrants | Sweden | 97.1 /100 | #114 | Exceptional $53,621 |
| Immigrants | Albania | 96.9 /100 | #115 | Exceptional $53,597 |
| Immigrants | Spain | 96.6 /100 | #116 | Exceptional $53,560 |
| Lithuanians | 96.6 /100 | #117 | Exceptional $53,552 |
| Immigrants | Switzerland | 96.3 /100 | #118 | Exceptional $53,528 |
| Italians | 95.4 /100 | #119 | Exceptional $53,426 |
Demographics Similar to Immigrants from Singapore by Householder Income Under 25 years
In terms of householder income under 25 years, the demographic groups most similar to Immigrants from Singapore are Immigrants from Pakistan ($56,789, a difference of 0.080%), Tongan ($56,972, a difference of 0.24%), Asian ($57,003, a difference of 0.29%), Immigrants from Australia ($56,660, a difference of 0.31%), and Immigrants from Ireland ($57,075, a difference of 0.42%).
| Demographics | Rating | Rank | Householder Income Under 25 years |
| Sierra Leoneans | 100.0 /100 | #17 | Exceptional $57,272 |
| Immigrants | Eastern Asia | 100.0 /100 | #18 | Exceptional $57,123 |
| Bhutanese | 100.0 /100 | #19 | Exceptional $57,078 |
| Immigrants | Ireland | 100.0 /100 | #20 | Exceptional $57,075 |
| Immigrants | Fiji | 100.0 /100 | #21 | Exceptional $57,074 |
| Asians | 100.0 /100 | #22 | Exceptional $57,003 |
| Tongans | 100.0 /100 | #23 | Exceptional $56,972 |
| Immigrants | Singapore | 100.0 /100 | #24 | Exceptional $56,835 |
| Immigrants | Pakistan | 100.0 /100 | #25 | Exceptional $56,789 |
| Immigrants | Australia | 100.0 /100 | #26 | Exceptional $56,660 |
| Immigrants | North Macedonia | 100.0 /100 | #27 | Exceptional $56,503 |
| Immigrants | Peru | 100.0 /100 | #28 | Exceptional $56,384 |
| Immigrants | Asia | 100.0 /100 | #29 | Exceptional $56,379 |
| Immigrants | Moldova | 100.0 /100 | #30 | Exceptional $56,168 |
| Vietnamese | 100.0 /100 | #31 | Exceptional $56,127 |