Carpatho Rusyn vs Ottawa Householder Income Under 25 years
COMPARE
Carpatho Rusyn
Ottawa
Householder Income Under 25 years
Householder Income Under 25 years Comparison
Carpatho Rusyns
Ottawa
$49,113
HOUSEHOLDER INCOME UNDER 25 YEARS
0.1/ 100
METRIC RATING
284th/ 347
METRIC RANK
$47,366
HOUSEHOLDER INCOME UNDER 25 YEARS
0.0/ 100
METRIC RATING
311th/ 347
METRIC RANK
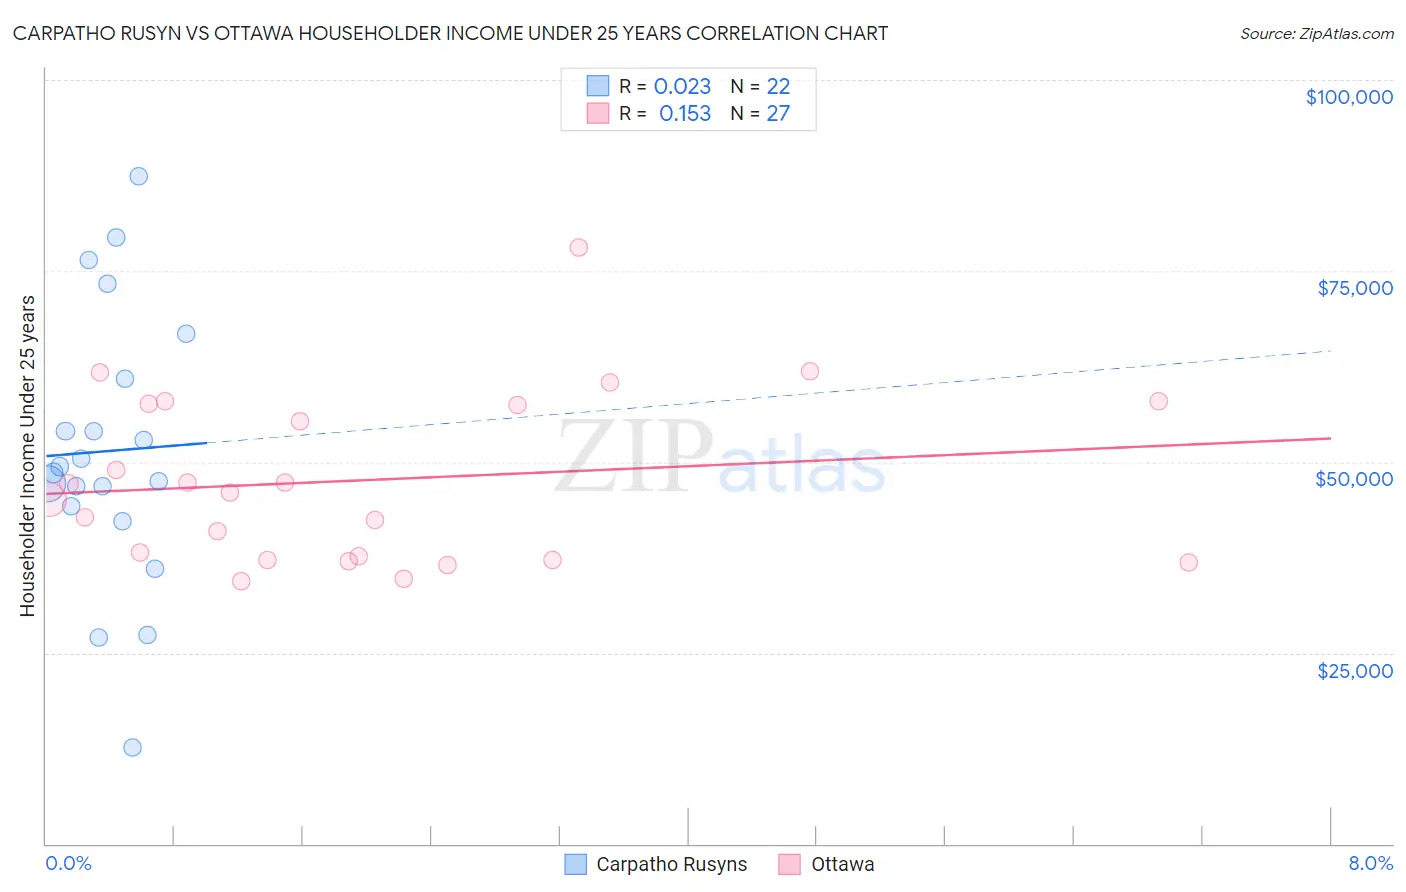
Carpatho Rusyn vs Ottawa Householder Income Under 25 years Correlation Chart
The statistical analysis conducted on geographies consisting of 54,713,704 people shows no correlation between the proportion of Carpatho Rusyns and household income with householder under the age of 25 in the United States with a correlation coefficient (R) of 0.023 and weighted average of $49,113. Similarly, the statistical analysis conducted on geographies consisting of 47,461,355 people shows a poor positive correlation between the proportion of Ottawa and household income with householder under the age of 25 in the United States with a correlation coefficient (R) of 0.153 and weighted average of $47,366, a difference of 3.7%.
Householder Income Under 25 years Correlation Summary
| Measurement | Carpatho Rusyn | Ottawa |
| Minimum | $12,634 | $34,394 |
| Maximum | $87,344 | $78,125 |
| Range | $74,710 | $43,731 |
| Mean | $51,412 | $47,623 |
| Median | $48,954 | $46,012 |
| Interquartile 25% (IQ1) | $44,244 | $37,201 |
| Interquartile 75% (IQ3) | $60,913 | $57,615 |
| Interquartile Range (IQR) | $16,669 | $20,414 |
| Standard Deviation (Sample) | $17,819 | $11,046 |
| Standard Deviation (Population) | $17,409 | $10,839 |
Similar Demographics by Householder Income Under 25 years
Demographics Similar to Carpatho Rusyns by Householder Income Under 25 years
In terms of householder income under 25 years, the demographic groups most similar to Carpatho Rusyns are Immigrants from Nigeria ($49,174, a difference of 0.12%), Scotch-Irish ($49,039, a difference of 0.15%), French American Indian ($48,977, a difference of 0.28%), Alsatian ($49,267, a difference of 0.31%), and Senegalese ($48,953, a difference of 0.33%).
| Demographics | Rating | Rank | Householder Income Under 25 years |
| Immigrants | Western Africa | 0.2 /100 | #277 | Tragic $49,621 |
| Nigerians | 0.1 /100 | #278 | Tragic $49,416 |
| Apache | 0.1 /100 | #279 | Tragic $49,395 |
| Hmong | 0.1 /100 | #280 | Tragic $49,364 |
| Immigrants | Nonimmigrants | 0.1 /100 | #281 | Tragic $49,348 |
| Alsatians | 0.1 /100 | #282 | Tragic $49,267 |
| Immigrants | Nigeria | 0.1 /100 | #283 | Tragic $49,174 |
| Carpatho Rusyns | 0.1 /100 | #284 | Tragic $49,113 |
| Scotch-Irish | 0.0 /100 | #285 | Tragic $49,039 |
| French American Indians | 0.0 /100 | #286 | Tragic $48,977 |
| Senegalese | 0.0 /100 | #287 | Tragic $48,953 |
| Liberians | 0.0 /100 | #288 | Tragic $48,917 |
| Hondurans | 0.0 /100 | #289 | Tragic $48,885 |
| Americans | 0.0 /100 | #290 | Tragic $48,860 |
| Immigrants | Burma/Myanmar | 0.0 /100 | #291 | Tragic $48,749 |
Demographics Similar to Ottawa by Householder Income Under 25 years
In terms of householder income under 25 years, the demographic groups most similar to Ottawa are Bermudan ($47,359, a difference of 0.010%), Iroquois ($47,380, a difference of 0.030%), U.S. Virgin Islander ($47,448, a difference of 0.17%), Comanche ($47,518, a difference of 0.32%), and Delaware ($47,159, a difference of 0.44%).
| Demographics | Rating | Rank | Householder Income Under 25 years |
| Menominee | 0.0 /100 | #304 | Tragic $47,907 |
| Cherokee | 0.0 /100 | #305 | Tragic $47,848 |
| Natives/Alaskans | 0.0 /100 | #306 | Tragic $47,704 |
| Bangladeshis | 0.0 /100 | #307 | Tragic $47,589 |
| Comanche | 0.0 /100 | #308 | Tragic $47,518 |
| U.S. Virgin Islanders | 0.0 /100 | #309 | Tragic $47,448 |
| Iroquois | 0.0 /100 | #310 | Tragic $47,380 |
| Ottawa | 0.0 /100 | #311 | Tragic $47,366 |
| Bermudans | 0.0 /100 | #312 | Tragic $47,359 |
| Delaware | 0.0 /100 | #313 | Tragic $47,159 |
| Chippewa | 0.0 /100 | #314 | Tragic $47,015 |
| Crow | 0.0 /100 | #315 | Tragic $47,012 |
| Sudanese | 0.0 /100 | #316 | Tragic $46,982 |
| Hopi | 0.0 /100 | #317 | Tragic $46,978 |
| Spanish Americans | 0.0 /100 | #318 | Tragic $46,913 |