Carpatho Rusyn vs Immigrants from Brazil Householder Income Under 25 years
COMPARE
Carpatho Rusyn
Immigrants from Brazil
Householder Income Under 25 years
Householder Income Under 25 years Comparison
Carpatho Rusyns
Immigrants from Brazil
$49,113
HOUSEHOLDER INCOME UNDER 25 YEARS
0.1/ 100
METRIC RATING
284th/ 347
METRIC RANK
$54,487
HOUSEHOLDER INCOME UNDER 25 YEARS
99.6/ 100
METRIC RATING
76th/ 347
METRIC RANK
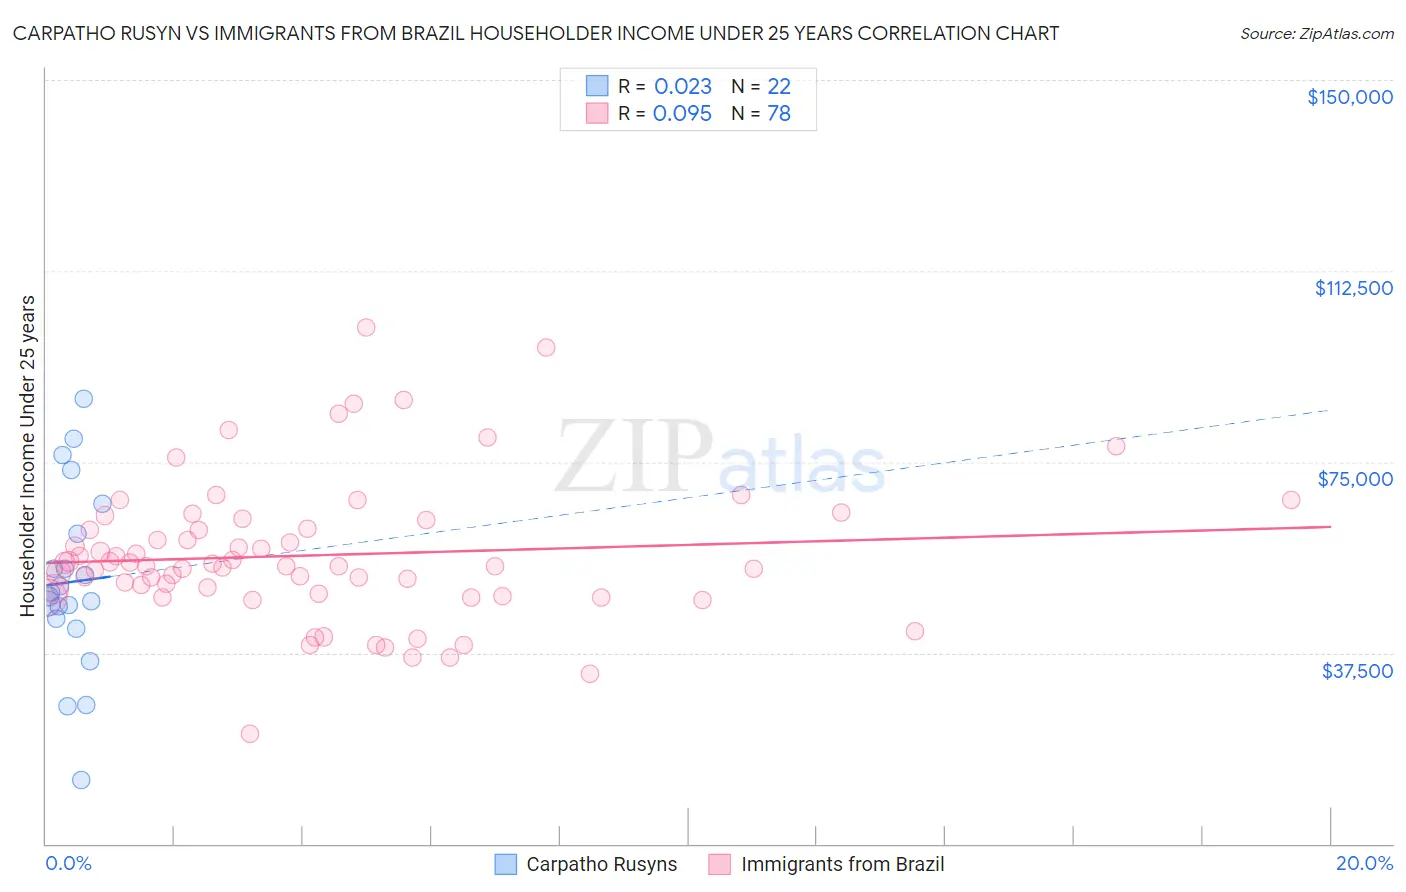
Carpatho Rusyn vs Immigrants from Brazil Householder Income Under 25 years Correlation Chart
The statistical analysis conducted on geographies consisting of 54,713,704 people shows no correlation between the proportion of Carpatho Rusyns and household income with householder under the age of 25 in the United States with a correlation coefficient (R) of 0.023 and weighted average of $49,113. Similarly, the statistical analysis conducted on geographies consisting of 290,809,322 people shows a slight positive correlation between the proportion of Immigrants from Brazil and household income with householder under the age of 25 in the United States with a correlation coefficient (R) of 0.095 and weighted average of $54,487, a difference of 10.9%.
Householder Income Under 25 years Correlation Summary
| Measurement | Carpatho Rusyn | Immigrants from Brazil |
| Minimum | $12,634 | $21,618 |
| Maximum | $87,344 | $101,440 |
| Range | $74,710 | $79,822 |
| Mean | $51,412 | $56,652 |
| Median | $48,954 | $54,576 |
| Interquartile 25% (IQ1) | $44,244 | $49,112 |
| Interquartile 75% (IQ3) | $60,913 | $61,875 |
| Interquartile Range (IQR) | $16,669 | $12,763 |
| Standard Deviation (Sample) | $17,819 | $13,948 |
| Standard Deviation (Population) | $17,409 | $13,859 |
Similar Demographics by Householder Income Under 25 years
Demographics Similar to Carpatho Rusyns by Householder Income Under 25 years
In terms of householder income under 25 years, the demographic groups most similar to Carpatho Rusyns are Immigrants from Nigeria ($49,174, a difference of 0.12%), Scotch-Irish ($49,039, a difference of 0.15%), French American Indian ($48,977, a difference of 0.28%), Alsatian ($49,267, a difference of 0.31%), and Senegalese ($48,953, a difference of 0.33%).
| Demographics | Rating | Rank | Householder Income Under 25 years |
| Immigrants | Western Africa | 0.2 /100 | #277 | Tragic $49,621 |
| Nigerians | 0.1 /100 | #278 | Tragic $49,416 |
| Apache | 0.1 /100 | #279 | Tragic $49,395 |
| Hmong | 0.1 /100 | #280 | Tragic $49,364 |
| Immigrants | Nonimmigrants | 0.1 /100 | #281 | Tragic $49,348 |
| Alsatians | 0.1 /100 | #282 | Tragic $49,267 |
| Immigrants | Nigeria | 0.1 /100 | #283 | Tragic $49,174 |
| Carpatho Rusyns | 0.1 /100 | #284 | Tragic $49,113 |
| Scotch-Irish | 0.0 /100 | #285 | Tragic $49,039 |
| French American Indians | 0.0 /100 | #286 | Tragic $48,977 |
| Senegalese | 0.0 /100 | #287 | Tragic $48,953 |
| Liberians | 0.0 /100 | #288 | Tragic $48,917 |
| Hondurans | 0.0 /100 | #289 | Tragic $48,885 |
| Americans | 0.0 /100 | #290 | Tragic $48,860 |
| Immigrants | Burma/Myanmar | 0.0 /100 | #291 | Tragic $48,749 |
Demographics Similar to Immigrants from Brazil by Householder Income Under 25 years
In terms of householder income under 25 years, the demographic groups most similar to Immigrants from Brazil are Immigrants from Southern Europe ($54,484, a difference of 0.010%), Nepalese ($54,472, a difference of 0.030%), Immigrants from Sri Lanka ($54,512, a difference of 0.050%), Immigrants from Italy ($54,449, a difference of 0.070%), and Egyptian ($54,444, a difference of 0.080%).
| Demographics | Rating | Rank | Householder Income Under 25 years |
| Samoans | 99.7 /100 | #69 | Exceptional $54,610 |
| Immigrants | El Salvador | 99.7 /100 | #70 | Exceptional $54,599 |
| Immigrants | Morocco | 99.7 /100 | #71 | Exceptional $54,593 |
| Immigrants | Northern Europe | 99.7 /100 | #72 | Exceptional $54,571 |
| Macedonians | 99.7 /100 | #73 | Exceptional $54,563 |
| Immigrants | Grenada | 99.7 /100 | #74 | Exceptional $54,538 |
| Immigrants | Sri Lanka | 99.7 /100 | #75 | Exceptional $54,512 |
| Immigrants | Brazil | 99.6 /100 | #76 | Exceptional $54,487 |
| Immigrants | Southern Europe | 99.6 /100 | #77 | Exceptional $54,484 |
| Nepalese | 99.6 /100 | #78 | Exceptional $54,472 |
| Immigrants | Italy | 99.6 /100 | #79 | Exceptional $54,449 |
| Egyptians | 99.6 /100 | #80 | Exceptional $54,444 |
| Portuguese | 99.6 /100 | #81 | Exceptional $54,436 |
| Russians | 99.5 /100 | #82 | Exceptional $54,389 |
| Laotians | 99.5 /100 | #83 | Exceptional $54,369 |