Carpatho Rusyn vs Immigrants from Middle Africa Householder Income Under 25 years
COMPARE
Carpatho Rusyn
Immigrants from Middle Africa
Householder Income Under 25 years
Householder Income Under 25 years Comparison
Carpatho Rusyns
Immigrants from Middle Africa
$49,113
HOUSEHOLDER INCOME UNDER 25 YEARS
0.1/ 100
METRIC RATING
284th/ 347
METRIC RANK
$47,916
HOUSEHOLDER INCOME UNDER 25 YEARS
0.0/ 100
METRIC RATING
303rd/ 347
METRIC RANK
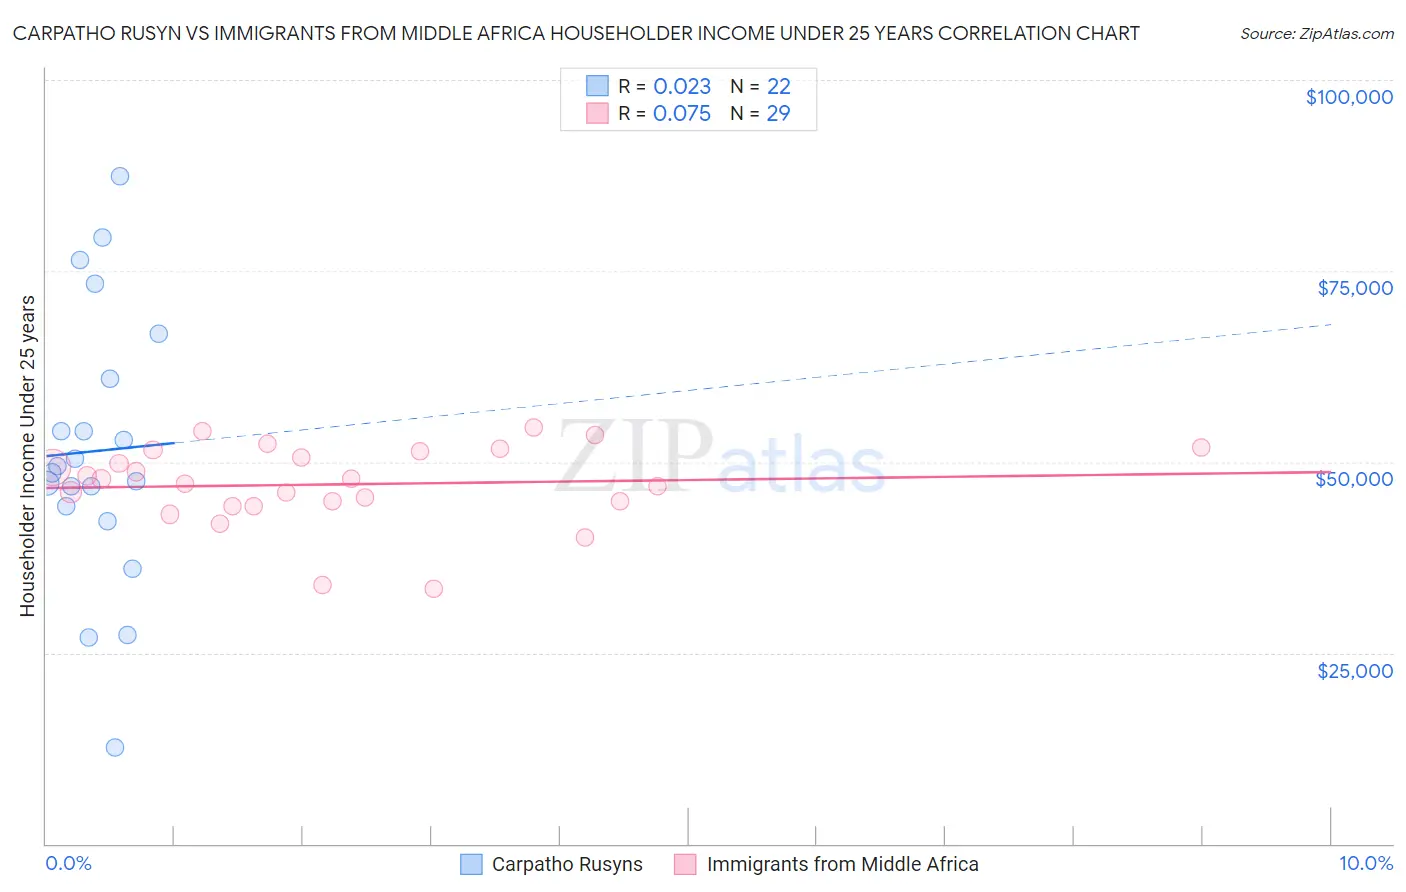
Carpatho Rusyn vs Immigrants from Middle Africa Householder Income Under 25 years Correlation Chart
The statistical analysis conducted on geographies consisting of 54,713,704 people shows no correlation between the proportion of Carpatho Rusyns and household income with householder under the age of 25 in the United States with a correlation coefficient (R) of 0.023 and weighted average of $49,113. Similarly, the statistical analysis conducted on geographies consisting of 185,124,339 people shows a slight positive correlation between the proportion of Immigrants from Middle Africa and household income with householder under the age of 25 in the United States with a correlation coefficient (R) of 0.075 and weighted average of $47,916, a difference of 2.5%.
Householder Income Under 25 years Correlation Summary
| Measurement | Carpatho Rusyn | Immigrants from Middle Africa |
| Minimum | $12,634 | $33,425 |
| Maximum | $87,344 | $54,425 |
| Range | $74,710 | $21,000 |
| Mean | $51,412 | $47,045 |
| Median | $48,954 | $47,736 |
| Interquartile 25% (IQ1) | $44,244 | $44,499 |
| Interquartile 75% (IQ3) | $60,913 | $51,465 |
| Interquartile Range (IQR) | $16,669 | $6,966 |
| Standard Deviation (Sample) | $17,819 | $5,237 |
| Standard Deviation (Population) | $17,409 | $5,146 |
Demographics Similar to Carpatho Rusyns and Immigrants from Middle Africa by Householder Income Under 25 years
In terms of householder income under 25 years, the demographic groups most similar to Carpatho Rusyns are Immigrants from Nigeria ($49,174, a difference of 0.12%), Scotch-Irish ($49,039, a difference of 0.15%), French American Indian ($48,977, a difference of 0.28%), Senegalese ($48,953, a difference of 0.33%), and Liberian ($48,917, a difference of 0.40%). Similarly, the demographic groups most similar to Immigrants from Middle Africa are Immigrants from Liberia ($47,981, a difference of 0.14%), Immigrants from Kuwait ($48,126, a difference of 0.44%), Immigrants from Somalia ($48,135, a difference of 0.46%), Immigrants from Honduras ($48,267, a difference of 0.73%), and Yaqui ($48,300, a difference of 0.80%).
| Demographics | Rating | Rank | Householder Income Under 25 years |
| Immigrants | Nigeria | 0.1 /100 | #283 | Tragic $49,174 |
| Carpatho Rusyns | 0.1 /100 | #284 | Tragic $49,113 |
| Scotch-Irish | 0.0 /100 | #285 | Tragic $49,039 |
| French American Indians | 0.0 /100 | #286 | Tragic $48,977 |
| Senegalese | 0.0 /100 | #287 | Tragic $48,953 |
| Liberians | 0.0 /100 | #288 | Tragic $48,917 |
| Hondurans | 0.0 /100 | #289 | Tragic $48,885 |
| Americans | 0.0 /100 | #290 | Tragic $48,860 |
| Immigrants | Burma/Myanmar | 0.0 /100 | #291 | Tragic $48,749 |
| Shoshone | 0.0 /100 | #292 | Tragic $48,720 |
| Sub-Saharan Africans | 0.0 /100 | #293 | Tragic $48,691 |
| Somalis | 0.0 /100 | #294 | Tragic $48,657 |
| Central American Indians | 0.0 /100 | #295 | Tragic $48,643 |
| Blackfeet | 0.0 /100 | #296 | Tragic $48,603 |
| Cree | 0.0 /100 | #297 | Tragic $48,514 |
| Yaqui | 0.0 /100 | #298 | Tragic $48,300 |
| Immigrants | Honduras | 0.0 /100 | #299 | Tragic $48,267 |
| Immigrants | Somalia | 0.0 /100 | #300 | Tragic $48,135 |
| Immigrants | Kuwait | 0.0 /100 | #301 | Tragic $48,126 |
| Immigrants | Liberia | 0.0 /100 | #302 | Tragic $47,981 |
| Immigrants | Middle Africa | 0.0 /100 | #303 | Tragic $47,916 |