Cape Verdean vs Immigrants from Nicaragua Householder Income Over 65 years
COMPARE
Cape Verdean
Immigrants from Nicaragua
Householder Income Over 65 years
Householder Income Over 65 years Comparison
Cape Verdeans
Immigrants from Nicaragua
$50,077
HOUSEHOLDER INCOME OVER 65 YEARS
0.0/ 100
METRIC RATING
333rd/ 347
METRIC RANK
$52,085
HOUSEHOLDER INCOME OVER 65 YEARS
0.0/ 100
METRIC RATING
313th/ 347
METRIC RANK
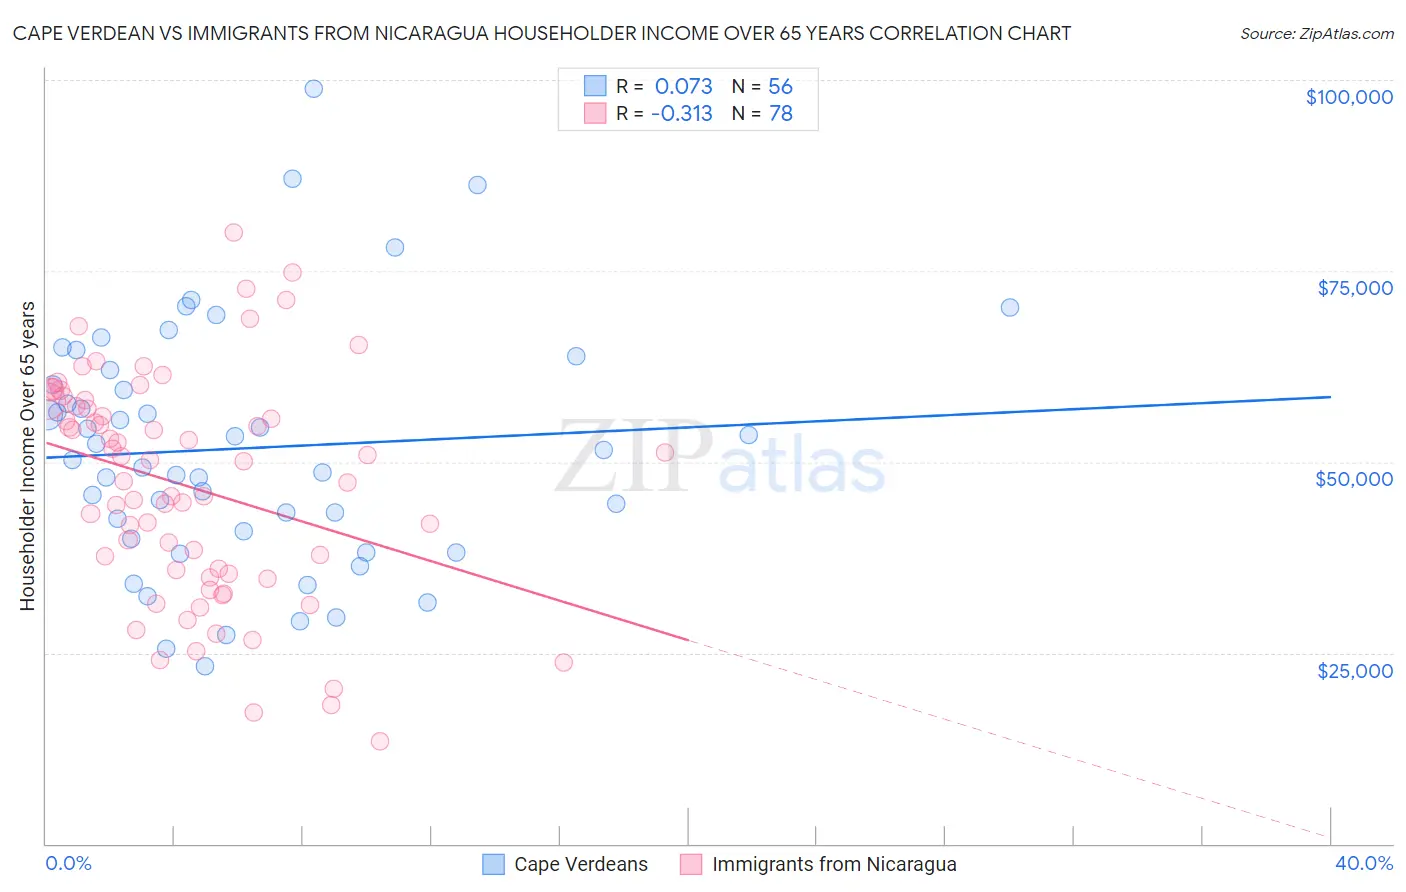
Cape Verdean vs Immigrants from Nicaragua Householder Income Over 65 years Correlation Chart
The statistical analysis conducted on geographies consisting of 107,432,324 people shows a slight positive correlation between the proportion of Cape Verdeans and household income with householder over the age of 65 in the United States with a correlation coefficient (R) of 0.073 and weighted average of $50,077. Similarly, the statistical analysis conducted on geographies consisting of 236,036,400 people shows a mild negative correlation between the proportion of Immigrants from Nicaragua and household income with householder over the age of 65 in the United States with a correlation coefficient (R) of -0.313 and weighted average of $52,085, a difference of 4.0%.
Householder Income Over 65 years Correlation Summary
| Measurement | Cape Verdean | Immigrants from Nicaragua |
| Minimum | $23,194 | $13,371 |
| Maximum | $98,819 | $80,000 |
| Range | $75,625 | $66,629 |
| Mean | $51,774 | $46,721 |
| Median | $50,968 | $48,735 |
| Interquartile 25% (IQ1) | $40,388 | $35,431 |
| Interquartile 75% (IQ3) | $61,045 | $57,245 |
| Interquartile Range (IQR) | $20,657 | $21,814 |
| Standard Deviation (Sample) | $15,999 | $14,647 |
| Standard Deviation (Population) | $15,855 | $14,553 |
Demographics Similar to Cape Verdeans and Immigrants from Nicaragua by Householder Income Over 65 years
In terms of householder income over 65 years, the demographic groups most similar to Cape Verdeans are Dutch West Indian ($50,475, a difference of 0.79%), Pima ($50,539, a difference of 0.92%), Immigrants from Grenada ($50,747, a difference of 1.3%), Black/African American ($50,779, a difference of 1.4%), and Hopi ($50,925, a difference of 1.7%). Similarly, the demographic groups most similar to Immigrants from Nicaragua are Native/Alaskan ($52,081, a difference of 0.010%), U.S. Virgin Islander ($52,072, a difference of 0.020%), Creek ($51,949, a difference of 0.26%), Immigrants from St. Vincent and the Grenadines ($51,922, a difference of 0.31%), and Haitian ($51,912, a difference of 0.33%).
| Demographics | Rating | Rank | Householder Income Over 65 years |
| Immigrants | Nicaragua | 0.0 /100 | #313 | Tragic $52,085 |
| Natives/Alaskans | 0.0 /100 | #314 | Tragic $52,081 |
| U.S. Virgin Islanders | 0.0 /100 | #315 | Tragic $52,072 |
| Creek | 0.0 /100 | #316 | Tragic $51,949 |
| Immigrants | St. Vincent and the Grenadines | 0.0 /100 | #317 | Tragic $51,922 |
| Haitians | 0.0 /100 | #318 | Tragic $51,912 |
| Immigrants | Honduras | 0.0 /100 | #319 | Tragic $51,888 |
| Colville | 0.0 /100 | #320 | Tragic $51,739 |
| Menominee | 0.0 /100 | #321 | Tragic $51,719 |
| British West Indians | 0.0 /100 | #322 | Tragic $51,463 |
| Cajuns | 0.0 /100 | #323 | Tragic $51,397 |
| Immigrants | Congo | 0.0 /100 | #324 | Tragic $51,393 |
| Immigrants | Haiti | 0.0 /100 | #325 | Tragic $51,219 |
| Kiowa | 0.0 /100 | #326 | Tragic $51,140 |
| Bahamians | 0.0 /100 | #327 | Tragic $51,000 |
| Hopi | 0.0 /100 | #328 | Tragic $50,925 |
| Blacks/African Americans | 0.0 /100 | #329 | Tragic $50,779 |
| Immigrants | Grenada | 0.0 /100 | #330 | Tragic $50,747 |
| Pima | 0.0 /100 | #331 | Tragic $50,539 |
| Dutch West Indians | 0.0 /100 | #332 | Tragic $50,475 |
| Cape Verdeans | 0.0 /100 | #333 | Tragic $50,077 |