Cape Verdean vs Pima Householder Income Ages 25 - 44 years
COMPARE
Cape Verdean
Pima
Householder Income Ages 25 - 44 years
Householder Income Ages 25 - 44 years Comparison
Cape Verdeans
Pima
$85,758
HOUSEHOLDER INCOME AGES 25 - 44 YEARS
0.8/ 100
METRIC RATING
251st/ 347
METRIC RANK
$82,821
HOUSEHOLDER INCOME AGES 25 - 44 YEARS
0.1/ 100
METRIC RATING
279th/ 347
METRIC RANK
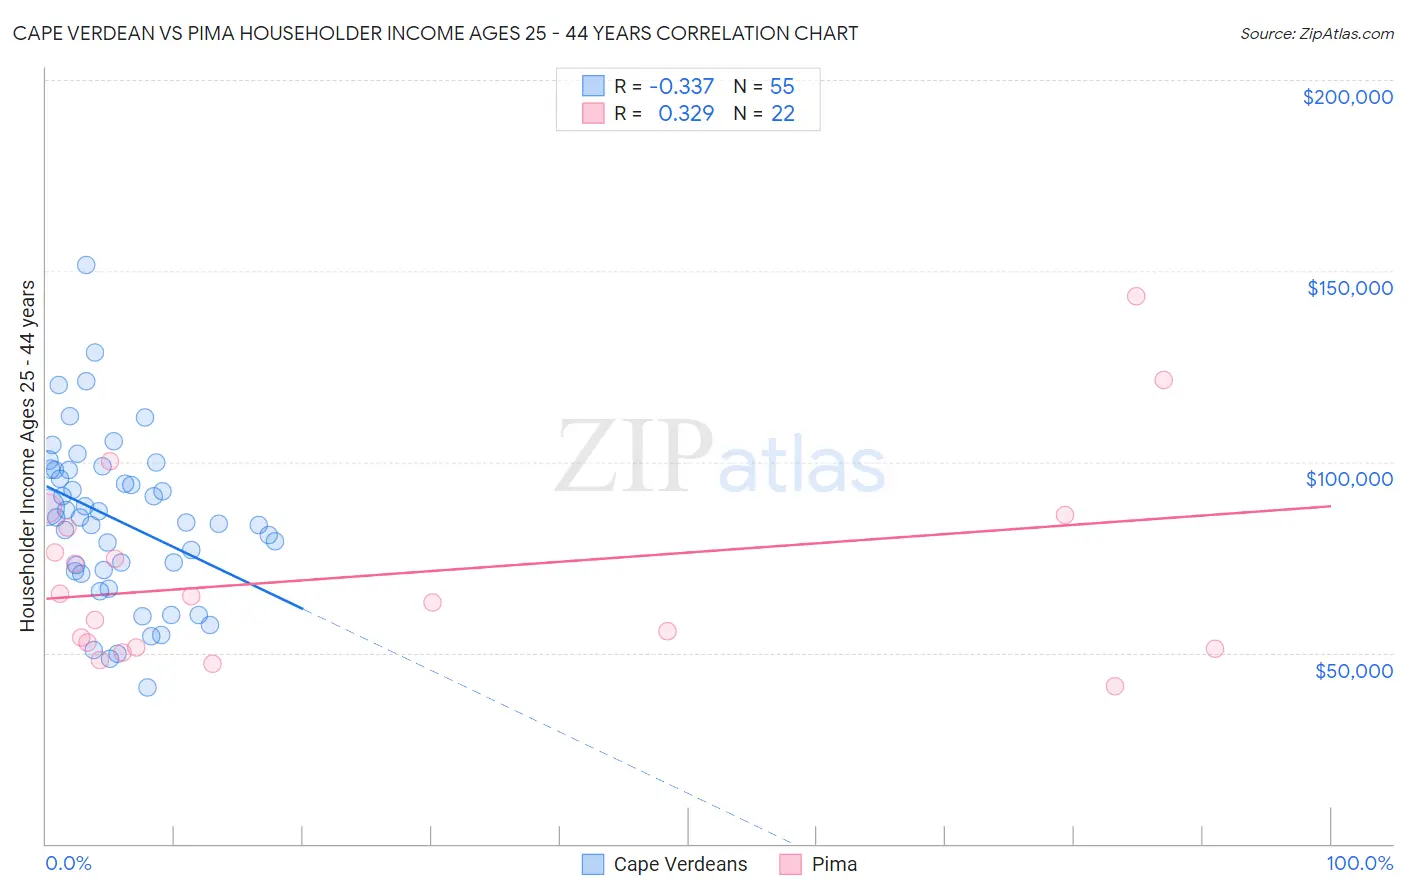
Cape Verdean vs Pima Householder Income Ages 25 - 44 years Correlation Chart
The statistical analysis conducted on geographies consisting of 107,474,022 people shows a mild negative correlation between the proportion of Cape Verdeans and household income with householder between the ages 25 and 44 in the United States with a correlation coefficient (R) of -0.337 and weighted average of $85,758. Similarly, the statistical analysis conducted on geographies consisting of 61,441,839 people shows a mild positive correlation between the proportion of Pima and household income with householder between the ages 25 and 44 in the United States with a correlation coefficient (R) of 0.329 and weighted average of $82,821, a difference of 3.5%.
Householder Income Ages 25 - 44 years Correlation Summary
| Measurement | Cape Verdean | Pima |
| Minimum | $41,033 | $41,167 |
| Maximum | $151,693 | $143,258 |
| Range | $110,660 | $102,091 |
| Mean | $84,702 | $70,457 |
| Median | $85,334 | $64,038 |
| Interquartile 25% (IQ1) | $71,313 | $51,500 |
| Interquartile 75% (IQ3) | $97,942 | $82,898 |
| Interquartile Range (IQR) | $26,629 | $31,398 |
| Standard Deviation (Sample) | $21,551 | $25,507 |
| Standard Deviation (Population) | $21,354 | $24,921 |
Similar Demographics by Householder Income Ages 25 - 44 years
Demographics Similar to Cape Verdeans by Householder Income Ages 25 - 44 years
In terms of householder income ages 25 - 44 years, the demographic groups most similar to Cape Verdeans are Pennsylvania German ($85,836, a difference of 0.090%), Immigrants from Western Africa ($85,676, a difference of 0.10%), French American Indian ($85,899, a difference of 0.16%), British West Indian ($85,565, a difference of 0.23%), and Immigrants from Laos ($85,553, a difference of 0.24%).
| Demographics | Rating | Rank | Householder Income Ages 25 - 44 years |
| Immigrants | Venezuela | 1.5 /100 | #244 | Tragic $87,038 |
| Immigrants | El Salvador | 1.4 /100 | #245 | Tragic $86,913 |
| Immigrants | Burma/Myanmar | 1.3 /100 | #246 | Tragic $86,736 |
| Immigrants | Nigeria | 1.2 /100 | #247 | Tragic $86,589 |
| Immigrants | Sudan | 0.9 /100 | #248 | Tragic $86,109 |
| French American Indians | 0.8 /100 | #249 | Tragic $85,899 |
| Pennsylvania Germans | 0.8 /100 | #250 | Tragic $85,836 |
| Cape Verdeans | 0.8 /100 | #251 | Tragic $85,758 |
| Immigrants | Western Africa | 0.7 /100 | #252 | Tragic $85,676 |
| British West Indians | 0.7 /100 | #253 | Tragic $85,565 |
| Immigrants | Laos | 0.7 /100 | #254 | Tragic $85,553 |
| German Russians | 0.6 /100 | #255 | Tragic $85,220 |
| Central Americans | 0.5 /100 | #256 | Tragic $85,144 |
| Mexican American Indians | 0.5 /100 | #257 | Tragic $85,066 |
| Immigrants | Nicaragua | 0.5 /100 | #258 | Tragic $84,914 |
Demographics Similar to Pima by Householder Income Ages 25 - 44 years
In terms of householder income ages 25 - 44 years, the demographic groups most similar to Pima are Senegalese ($82,852, a difference of 0.040%), Paiute ($82,984, a difference of 0.20%), Colville ($82,604, a difference of 0.26%), Immigrants from Belize ($83,141, a difference of 0.39%), and Cajun ($82,393, a difference of 0.52%).
| Demographics | Rating | Rank | Householder Income Ages 25 - 44 years |
| Spanish Americans | 0.2 /100 | #272 | Tragic $83,722 |
| Iroquois | 0.2 /100 | #273 | Tragic $83,682 |
| Marshallese | 0.2 /100 | #274 | Tragic $83,575 |
| Immigrants | Jamaica | 0.2 /100 | #275 | Tragic $83,298 |
| Immigrants | Belize | 0.2 /100 | #276 | Tragic $83,141 |
| Paiute | 0.2 /100 | #277 | Tragic $82,984 |
| Senegalese | 0.2 /100 | #278 | Tragic $82,852 |
| Pima | 0.1 /100 | #279 | Tragic $82,821 |
| Colville | 0.1 /100 | #280 | Tragic $82,604 |
| Cajuns | 0.1 /100 | #281 | Tragic $82,393 |
| Central American Indians | 0.1 /100 | #282 | Tragic $82,355 |
| Guatemalans | 0.1 /100 | #283 | Tragic $82,331 |
| Immigrants | Middle Africa | 0.1 /100 | #284 | Tragic $82,254 |
| Immigrants | Somalia | 0.1 /100 | #285 | Tragic $82,188 |
| Ute | 0.1 /100 | #286 | Tragic $82,166 |