Bangladeshi vs Immigrants from Korea Householder Income Ages 45 - 64 years
COMPARE
Bangladeshi
Immigrants from Korea
Householder Income Ages 45 - 64 years
Householder Income Ages 45 - 64 years Comparison
Bangladeshis
Immigrants from Korea
$86,402
HOUSEHOLDER INCOME AGES 45 - 64 YEARS
0.1/ 100
METRIC RATING
287th/ 347
METRIC RANK
$121,243
HOUSEHOLDER INCOME AGES 45 - 64 YEARS
100.0/ 100
METRIC RATING
18th/ 347
METRIC RANK
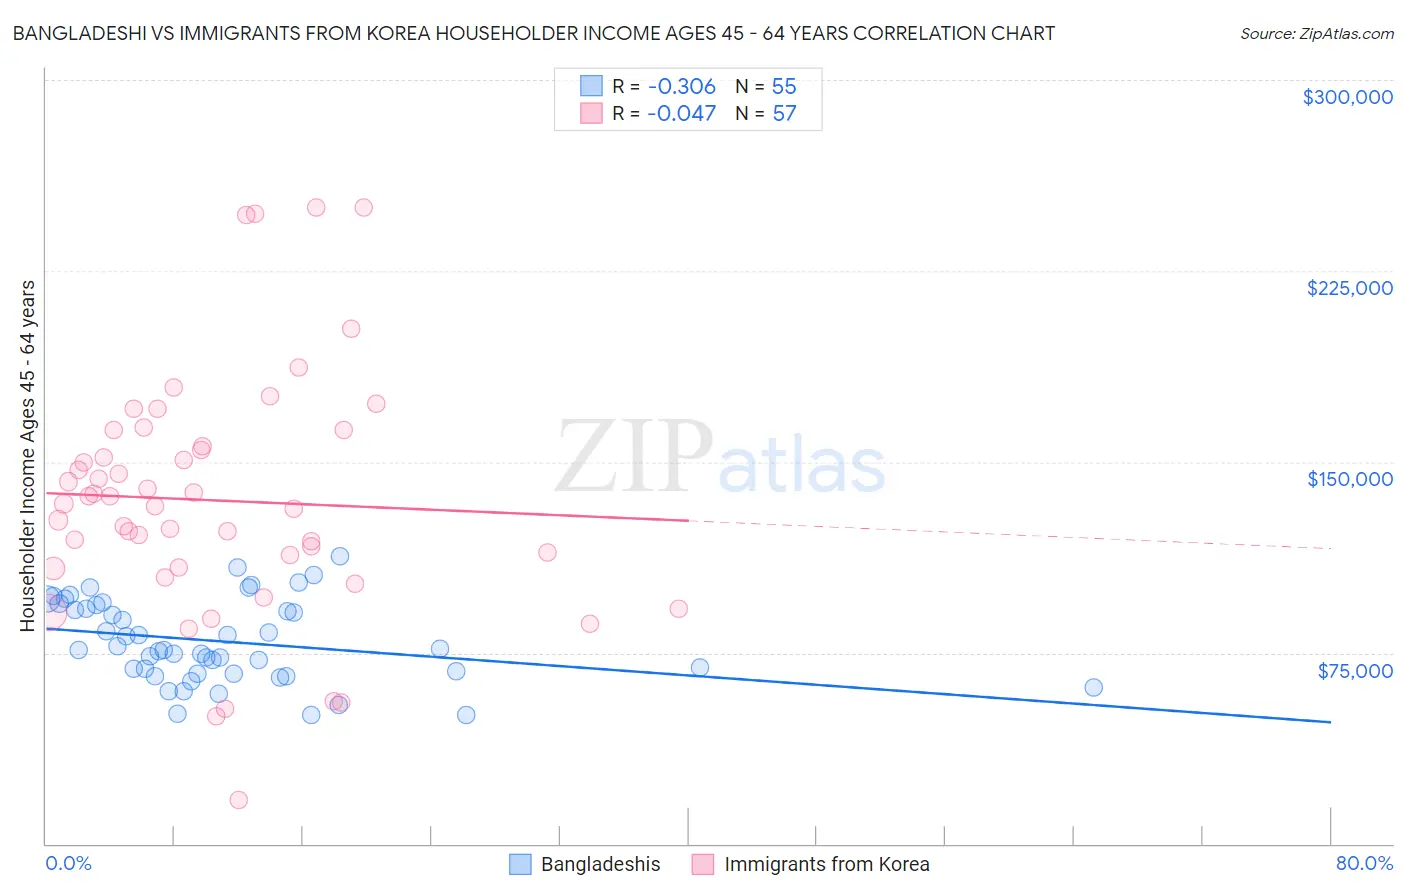
Bangladeshi vs Immigrants from Korea Householder Income Ages 45 - 64 years Correlation Chart
The statistical analysis conducted on geographies consisting of 141,236,471 people shows a mild negative correlation between the proportion of Bangladeshis and household income with householder between the ages 45 and 64 in the United States with a correlation coefficient (R) of -0.306 and weighted average of $86,402. Similarly, the statistical analysis conducted on geographies consisting of 415,490,363 people shows no correlation between the proportion of Immigrants from Korea and household income with householder between the ages 45 and 64 in the United States with a correlation coefficient (R) of -0.047 and weighted average of $121,243, a difference of 40.3%.
Householder Income Ages 45 - 64 years Correlation Summary
| Measurement | Bangladeshi | Immigrants from Korea |
| Minimum | $50,598 | $17,326 |
| Maximum | $113,000 | $250,001 |
| Range | $62,402 | $232,675 |
| Mean | $79,486 | $134,865 |
| Median | $76,107 | $133,392 |
| Interquartile 25% (IQ1) | $66,969 | $108,375 |
| Interquartile 75% (IQ3) | $93,746 | $159,271 |
| Interquartile Range (IQR) | $26,777 | $50,896 |
| Standard Deviation (Sample) | $15,976 | $48,086 |
| Standard Deviation (Population) | $15,831 | $47,662 |
Similar Demographics by Householder Income Ages 45 - 64 years
Demographics Similar to Bangladeshis by Householder Income Ages 45 - 64 years
In terms of householder income ages 45 - 64 years, the demographic groups most similar to Bangladeshis are Immigrants from St. Vincent and the Grenadines ($86,394, a difference of 0.010%), Cuban ($86,301, a difference of 0.12%), Immigrants from Guatemala ($86,573, a difference of 0.20%), Blackfeet ($86,595, a difference of 0.22%), and Cherokee ($86,125, a difference of 0.32%).
| Demographics | Rating | Rank | Householder Income Ages 45 - 64 years |
| Immigrants | Somalia | 0.1 /100 | #280 | Tragic $86,987 |
| Yaqui | 0.1 /100 | #281 | Tragic $86,914 |
| Senegalese | 0.1 /100 | #282 | Tragic $86,897 |
| Mexicans | 0.1 /100 | #283 | Tragic $86,816 |
| Central American Indians | 0.1 /100 | #284 | Tragic $86,764 |
| Blackfeet | 0.1 /100 | #285 | Tragic $86,595 |
| Immigrants | Guatemala | 0.1 /100 | #286 | Tragic $86,573 |
| Bangladeshis | 0.1 /100 | #287 | Tragic $86,402 |
| Immigrants | St. Vincent and the Grenadines | 0.1 /100 | #288 | Tragic $86,394 |
| Cubans | 0.1 /100 | #289 | Tragic $86,301 |
| Cherokee | 0.1 /100 | #290 | Tragic $86,125 |
| Hispanics or Latinos | 0.1 /100 | #291 | Tragic $86,006 |
| Immigrants | Central America | 0.1 /100 | #292 | Tragic $85,965 |
| Comanche | 0.1 /100 | #293 | Tragic $85,787 |
| British West Indians | 0.1 /100 | #294 | Tragic $85,571 |
Demographics Similar to Immigrants from Korea by Householder Income Ages 45 - 64 years
In terms of householder income ages 45 - 64 years, the demographic groups most similar to Immigrants from Korea are Burmese ($121,444, a difference of 0.17%), Eastern European ($120,684, a difference of 0.46%), Immigrants from China ($122,178, a difference of 0.77%), Immigrants from Eastern Asia ($122,222, a difference of 0.81%), and Indian (Asian) ($122,343, a difference of 0.91%).
| Demographics | Rating | Rank | Householder Income Ages 45 - 64 years |
| Cypriots | 100.0 /100 | #11 | Exceptional $123,396 |
| Immigrants | Israel | 100.0 /100 | #12 | Exceptional $122,893 |
| Immigrants | Ireland | 100.0 /100 | #13 | Exceptional $122,757 |
| Indians (Asian) | 100.0 /100 | #14 | Exceptional $122,343 |
| Immigrants | Eastern Asia | 100.0 /100 | #15 | Exceptional $122,222 |
| Immigrants | China | 100.0 /100 | #16 | Exceptional $122,178 |
| Burmese | 100.0 /100 | #17 | Exceptional $121,444 |
| Immigrants | Korea | 100.0 /100 | #18 | Exceptional $121,243 |
| Eastern Europeans | 100.0 /100 | #19 | Exceptional $120,684 |
| Immigrants | Australia | 100.0 /100 | #20 | Exceptional $119,308 |
| Immigrants | Sri Lanka | 100.0 /100 | #21 | Exceptional $119,094 |
| Immigrants | Belgium | 100.0 /100 | #22 | Exceptional $118,932 |
| Bolivians | 100.0 /100 | #23 | Exceptional $118,871 |
| Immigrants | Japan | 100.0 /100 | #24 | Exceptional $118,498 |
| Asians | 100.0 /100 | #25 | Exceptional $118,426 |