Canadian vs Immigrants from Bahamas Householder Income Ages 45 - 64 years
COMPARE
Canadian
Immigrants from Bahamas
Householder Income Ages 45 - 64 years
Householder Income Ages 45 - 64 years Comparison
Canadians
Immigrants from Bahamas
$104,560
HOUSEHOLDER INCOME AGES 45 - 64 YEARS
89.3/ 100
METRIC RATING
134th/ 347
METRIC RANK
$83,177
HOUSEHOLDER INCOME AGES 45 - 64 YEARS
0.0/ 100
METRIC RATING
311th/ 347
METRIC RANK
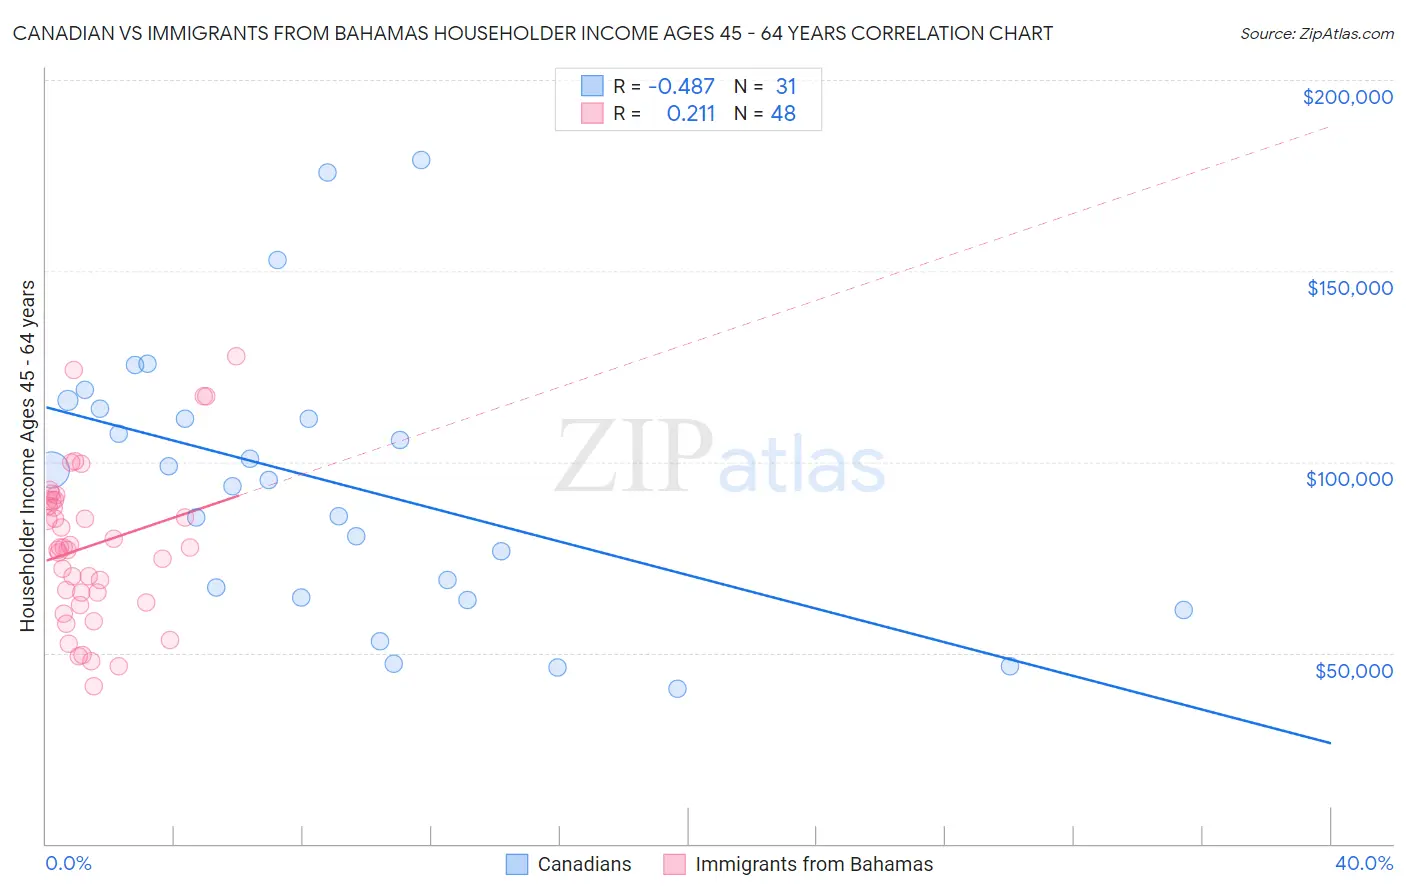
Canadian vs Immigrants from Bahamas Householder Income Ages 45 - 64 years Correlation Chart
The statistical analysis conducted on geographies consisting of 436,616,971 people shows a moderate negative correlation between the proportion of Canadians and household income with householder between the ages 45 and 64 in the United States with a correlation coefficient (R) of -0.487 and weighted average of $104,560. Similarly, the statistical analysis conducted on geographies consisting of 104,531,402 people shows a weak positive correlation between the proportion of Immigrants from Bahamas and household income with householder between the ages 45 and 64 in the United States with a correlation coefficient (R) of 0.211 and weighted average of $83,177, a difference of 25.7%.
Householder Income Ages 45 - 64 years Correlation Summary
| Measurement | Canadian | Immigrants from Bahamas |
| Minimum | $40,750 | $41,195 |
| Maximum | $178,981 | $127,688 |
| Range | $138,231 | $86,493 |
| Mean | $94,099 | $78,060 |
| Median | $95,411 | $77,570 |
| Interquartile 25% (IQ1) | $64,375 | $64,406 |
| Interquartile 75% (IQ3) | $113,872 | $89,869 |
| Interquartile Range (IQR) | $49,497 | $25,463 |
| Standard Deviation (Sample) | $35,584 | $20,104 |
| Standard Deviation (Population) | $35,005 | $19,893 |
Similar Demographics by Householder Income Ages 45 - 64 years
Demographics Similar to Canadians by Householder Income Ages 45 - 64 years
In terms of householder income ages 45 - 64 years, the demographic groups most similar to Canadians are Arab ($104,566, a difference of 0.010%), Brazilian ($104,408, a difference of 0.15%), Lebanese ($104,734, a difference of 0.17%), Immigrants from Syria ($104,858, a difference of 0.29%), and Taiwanese ($104,180, a difference of 0.36%).
| Demographics | Rating | Rank | Householder Income Ages 45 - 64 years |
| Immigrants | Saudi Arabia | 92.2 /100 | #127 | Exceptional $105,249 |
| Native Hawaiians | 91.8 /100 | #128 | Exceptional $105,149 |
| Peruvians | 91.5 /100 | #129 | Exceptional $105,070 |
| Immigrants | Zimbabwe | 91.2 /100 | #130 | Exceptional $104,992 |
| Immigrants | Syria | 90.7 /100 | #131 | Exceptional $104,858 |
| Lebanese | 90.1 /100 | #132 | Exceptional $104,734 |
| Arabs | 89.3 /100 | #133 | Excellent $104,566 |
| Canadians | 89.3 /100 | #134 | Excellent $104,560 |
| Brazilians | 88.6 /100 | #135 | Excellent $104,408 |
| Taiwanese | 87.4 /100 | #136 | Excellent $104,180 |
| Hungarians | 85.8 /100 | #137 | Excellent $103,913 |
| Ethiopians | 84.7 /100 | #138 | Excellent $103,736 |
| Immigrants | Oceania | 84.5 /100 | #139 | Excellent $103,705 |
| Norwegians | 84.3 /100 | #140 | Excellent $103,682 |
| Immigrants | Uganda | 83.7 /100 | #141 | Excellent $103,584 |
Demographics Similar to Immigrants from Bahamas by Householder Income Ages 45 - 64 years
In terms of householder income ages 45 - 64 years, the demographic groups most similar to Immigrants from Bahamas are Immigrants from Haiti ($83,257, a difference of 0.10%), Immigrants from Dominica ($83,311, a difference of 0.16%), Cajun ($83,015, a difference of 0.20%), Immigrants from Cabo Verde ($83,542, a difference of 0.44%), and Shoshone ($83,588, a difference of 0.49%).
| Demographics | Rating | Rank | Householder Income Ages 45 - 64 years |
| Ottawa | 0.0 /100 | #304 | Tragic $83,953 |
| Chippewa | 0.0 /100 | #305 | Tragic $83,943 |
| Ute | 0.0 /100 | #306 | Tragic $83,937 |
| Shoshone | 0.0 /100 | #307 | Tragic $83,588 |
| Immigrants | Cabo Verde | 0.0 /100 | #308 | Tragic $83,542 |
| Immigrants | Dominica | 0.0 /100 | #309 | Tragic $83,311 |
| Immigrants | Haiti | 0.0 /100 | #310 | Tragic $83,257 |
| Immigrants | Bahamas | 0.0 /100 | #311 | Tragic $83,177 |
| Cajuns | 0.0 /100 | #312 | Tragic $83,015 |
| U.S. Virgin Islanders | 0.0 /100 | #313 | Tragic $82,736 |
| Immigrants | Honduras | 0.0 /100 | #314 | Tragic $82,697 |
| Paiute | 0.0 /100 | #315 | Tragic $82,629 |
| Immigrants | Caribbean | 0.0 /100 | #316 | Tragic $82,513 |
| Colville | 0.0 /100 | #317 | Tragic $82,474 |
| Choctaw | 0.0 /100 | #318 | Tragic $82,287 |