Chinese vs Immigrants from Korea Householder Income Ages 45 - 64 years
COMPARE
Chinese
Immigrants from Korea
Householder Income Ages 45 - 64 years
Householder Income Ages 45 - 64 years Comparison
Chinese
Immigrants from Korea
$116,156
HOUSEHOLDER INCOME AGES 45 - 64 YEARS
100.0/ 100
METRIC RATING
33rd/ 347
METRIC RANK
$121,243
HOUSEHOLDER INCOME AGES 45 - 64 YEARS
100.0/ 100
METRIC RATING
18th/ 347
METRIC RANK
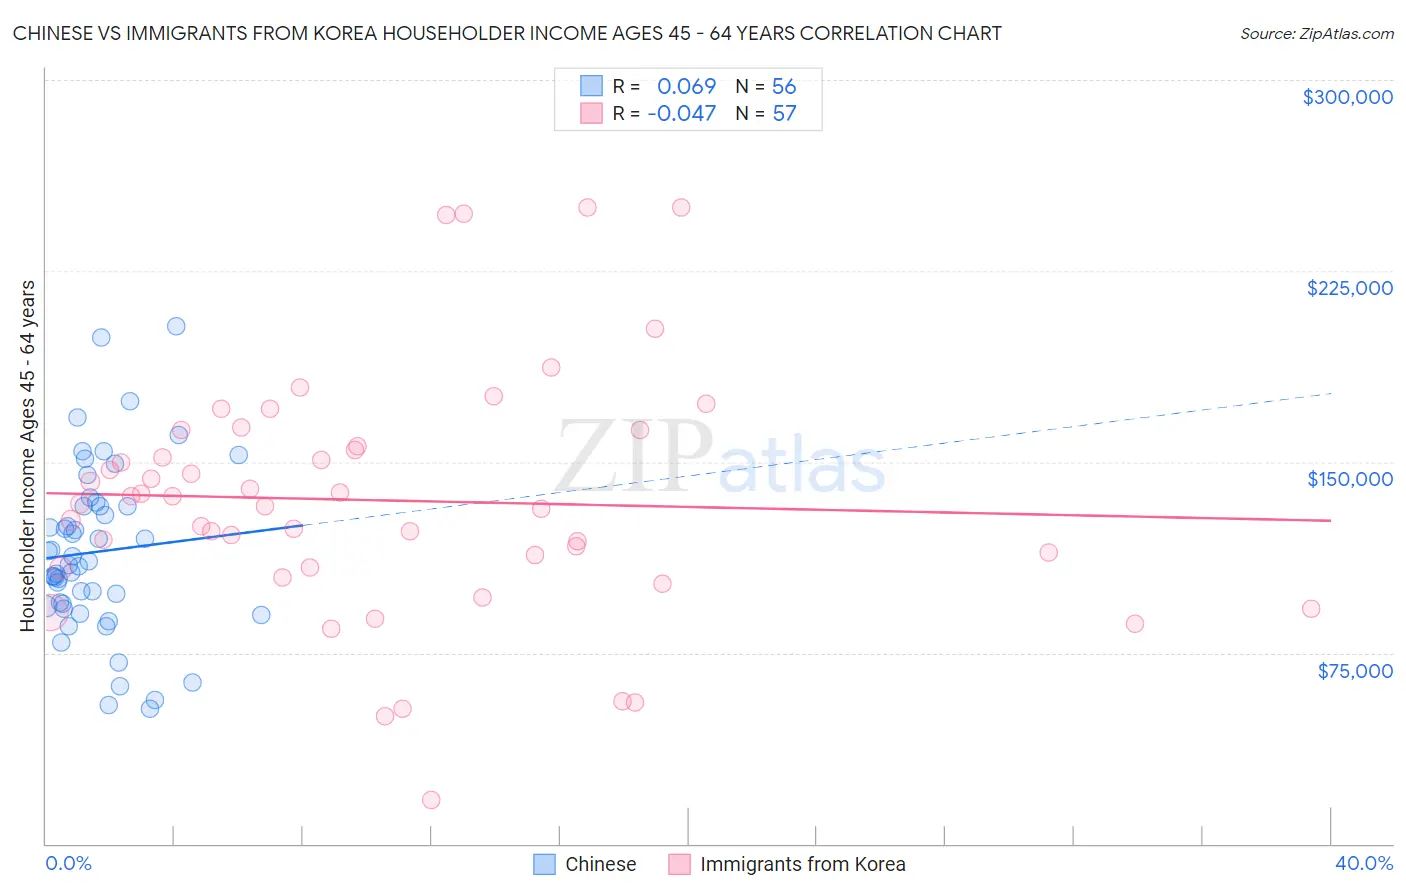
Chinese vs Immigrants from Korea Householder Income Ages 45 - 64 years Correlation Chart
The statistical analysis conducted on geographies consisting of 64,773,263 people shows a slight positive correlation between the proportion of Chinese and household income with householder between the ages 45 and 64 in the United States with a correlation coefficient (R) of 0.069 and weighted average of $116,156. Similarly, the statistical analysis conducted on geographies consisting of 415,490,363 people shows no correlation between the proportion of Immigrants from Korea and household income with householder between the ages 45 and 64 in the United States with a correlation coefficient (R) of -0.047 and weighted average of $121,243, a difference of 4.4%.
Householder Income Ages 45 - 64 years Correlation Summary
| Measurement | Chinese | Immigrants from Korea |
| Minimum | $52,969 | $17,326 |
| Maximum | $203,211 | $250,001 |
| Range | $150,242 | $232,675 |
| Mean | $114,652 | $134,865 |
| Median | $110,020 | $133,392 |
| Interquartile 25% (IQ1) | $93,748 | $108,375 |
| Interquartile 75% (IQ3) | $132,670 | $159,271 |
| Interquartile Range (IQR) | $38,922 | $50,896 |
| Standard Deviation (Sample) | $33,042 | $48,086 |
| Standard Deviation (Population) | $32,746 | $47,662 |
Demographics Similar to Chinese and Immigrants from Korea by Householder Income Ages 45 - 64 years
In terms of householder income ages 45 - 64 years, the demographic groups most similar to Chinese are Immigrants from Denmark ($116,000, a difference of 0.13%), Russian ($116,328, a difference of 0.15%), Latvian ($115,957, a difference of 0.17%), Immigrants from Asia ($116,566, a difference of 0.35%), and Immigrants from Bolivia ($117,731, a difference of 1.4%). Similarly, the demographic groups most similar to Immigrants from Korea are Burmese ($121,444, a difference of 0.17%), Eastern European ($120,684, a difference of 0.46%), Immigrants from China ($122,178, a difference of 0.77%), Immigrants from Eastern Asia ($122,222, a difference of 0.81%), and Immigrants from Australia ($119,308, a difference of 1.6%).
| Demographics | Rating | Rank | Householder Income Ages 45 - 64 years |
| Immigrants | Eastern Asia | 100.0 /100 | #15 | Exceptional $122,222 |
| Immigrants | China | 100.0 /100 | #16 | Exceptional $122,178 |
| Burmese | 100.0 /100 | #17 | Exceptional $121,444 |
| Immigrants | Korea | 100.0 /100 | #18 | Exceptional $121,243 |
| Eastern Europeans | 100.0 /100 | #19 | Exceptional $120,684 |
| Immigrants | Australia | 100.0 /100 | #20 | Exceptional $119,308 |
| Immigrants | Sri Lanka | 100.0 /100 | #21 | Exceptional $119,094 |
| Immigrants | Belgium | 100.0 /100 | #22 | Exceptional $118,932 |
| Bolivians | 100.0 /100 | #23 | Exceptional $118,871 |
| Immigrants | Japan | 100.0 /100 | #24 | Exceptional $118,498 |
| Asians | 100.0 /100 | #25 | Exceptional $118,426 |
| Immigrants | Sweden | 100.0 /100 | #26 | Exceptional $118,318 |
| Immigrants | Northern Europe | 100.0 /100 | #27 | Exceptional $117,930 |
| Turks | 100.0 /100 | #28 | Exceptional $117,814 |
| Bhutanese | 100.0 /100 | #29 | Exceptional $117,750 |
| Immigrants | Bolivia | 100.0 /100 | #30 | Exceptional $117,731 |
| Immigrants | Asia | 100.0 /100 | #31 | Exceptional $116,566 |
| Russians | 100.0 /100 | #32 | Exceptional $116,328 |
| Chinese | 100.0 /100 | #33 | Exceptional $116,156 |
| Immigrants | Denmark | 100.0 /100 | #34 | Exceptional $116,000 |
| Latvians | 100.0 /100 | #35 | Exceptional $115,957 |