Cambodian vs Bolivian 7th Grade
COMPARE
Cambodian
Bolivian
7th Grade
7th Grade Comparison
Cambodians
Bolivians
96.3%
7TH GRADE
88.3/ 100
METRIC RATING
140th/ 347
METRIC RANK
95.4%
7TH GRADE
1.1/ 100
METRIC RATING
249th/ 347
METRIC RANK
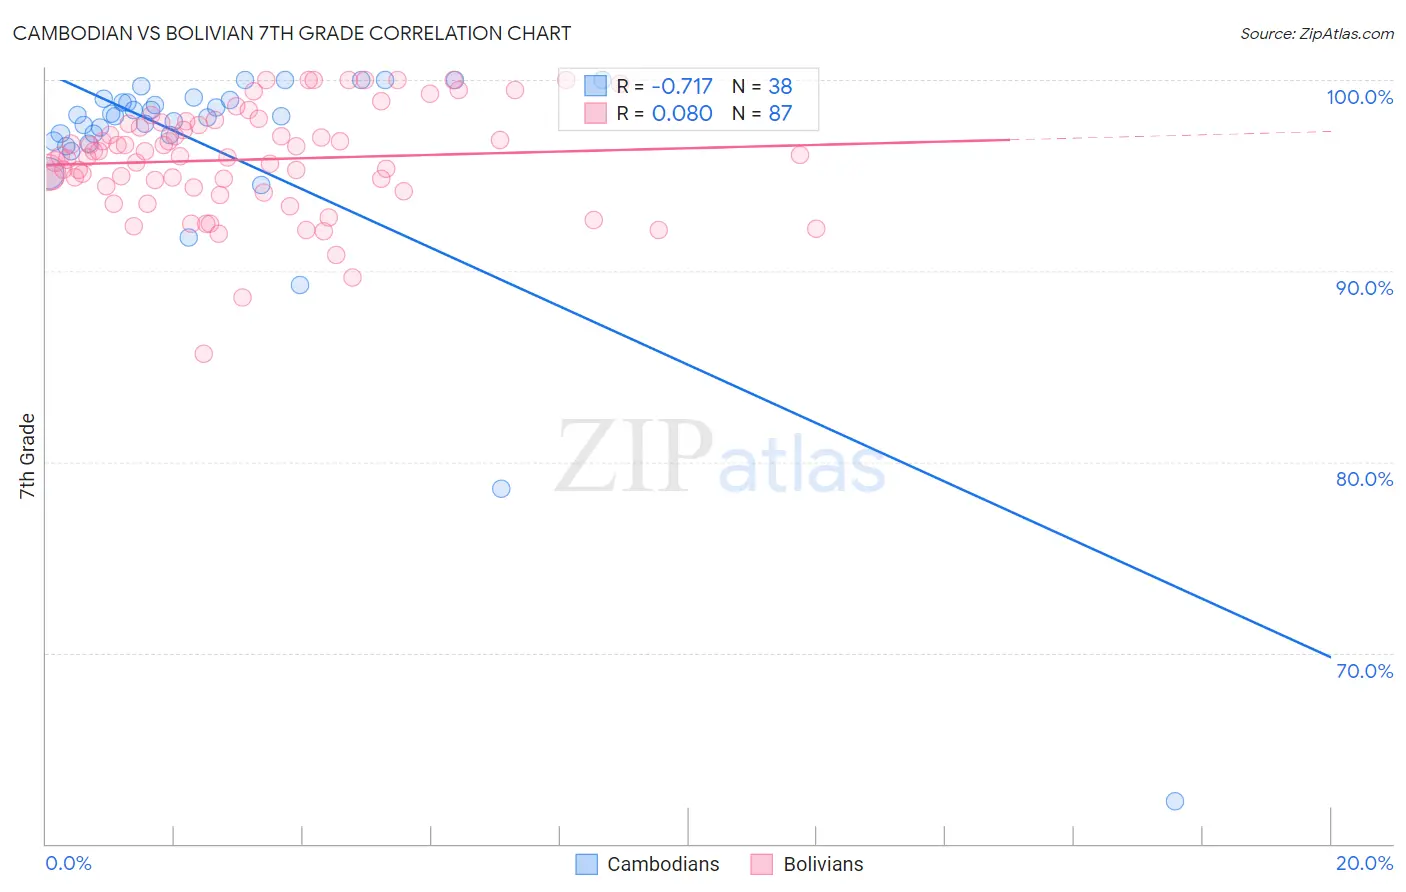
Cambodian vs Bolivian 7th Grade Correlation Chart
The statistical analysis conducted on geographies consisting of 102,514,976 people shows a strong negative correlation between the proportion of Cambodians and percentage of population with at least 7th grade education in the United States with a correlation coefficient (R) of -0.717 and weighted average of 96.3%. Similarly, the statistical analysis conducted on geographies consisting of 184,666,822 people shows a slight positive correlation between the proportion of Bolivians and percentage of population with at least 7th grade education in the United States with a correlation coefficient (R) of 0.080 and weighted average of 95.4%, a difference of 1.0%.
7th Grade Correlation Summary
| Measurement | Cambodian | Bolivian |
| Minimum | 62.2% | 85.7% |
| Maximum | 100.0% | 100.0% |
| Range | 37.8% | 14.3% |
| Mean | 96.3% | 95.8% |
| Median | 98.1% | 96.0% |
| Interquartile 25% (IQ1) | 96.8% | 94.4% |
| Interquartile 75% (IQ3) | 99.0% | 97.7% |
| Interquartile Range (IQR) | 2.2% | 3.3% |
| Standard Deviation (Sample) | 6.8% | 2.8% |
| Standard Deviation (Population) | 6.7% | 2.8% |
Similar Demographics by 7th Grade
Demographics Similar to Cambodians by 7th Grade
In terms of 7th grade, the demographic groups most similar to Cambodians are Basque (96.4%, a difference of 0.020%), Immigrants from South Central Asia (96.3%, a difference of 0.020%), Burmese (96.3%, a difference of 0.020%), Spanish (96.3%, a difference of 0.020%), and Immigrants from Turkey (96.4%, a difference of 0.030%).
| Demographics | Rating | Rank | 7th Grade |
| Hmong | 91.5 /100 | #133 | Exceptional 96.4% |
| Soviet Union | 91.2 /100 | #134 | Exceptional 96.4% |
| Immigrants | Kuwait | 91.1 /100 | #135 | Exceptional 96.4% |
| Immigrants | Hungary | 90.6 /100 | #136 | Exceptional 96.4% |
| Immigrants | Turkey | 90.2 /100 | #137 | Exceptional 96.4% |
| Jordanians | 90.0 /100 | #138 | Excellent 96.4% |
| Basques | 89.3 /100 | #139 | Excellent 96.4% |
| Cambodians | 88.3 /100 | #140 | Excellent 96.3% |
| Immigrants | South Central Asia | 87.1 /100 | #141 | Excellent 96.3% |
| Burmese | 87.1 /100 | #142 | Excellent 96.3% |
| Spanish | 86.6 /100 | #143 | Excellent 96.3% |
| Immigrants | Greece | 85.9 /100 | #144 | Excellent 96.3% |
| Blackfeet | 83.9 /100 | #145 | Excellent 96.3% |
| Immigrants | Eastern Europe | 83.7 /100 | #146 | Excellent 96.3% |
| French American Indians | 83.1 /100 | #147 | Excellent 96.3% |
Demographics Similar to Bolivians by 7th Grade
In terms of 7th grade, the demographic groups most similar to Bolivians are Paiute (95.4%, a difference of 0.010%), Immigrants from Cameroon (95.4%, a difference of 0.020%), Immigrants from Jamaica (95.4%, a difference of 0.020%), Tongan (95.4%, a difference of 0.030%), and Immigrants from Ethiopia (95.3%, a difference of 0.030%).
| Demographics | Rating | Rank | 7th Grade |
| Immigrants | Senegal | 1.9 /100 | #242 | Tragic 95.5% |
| U.S. Virgin Islanders | 1.6 /100 | #243 | Tragic 95.4% |
| Uruguayans | 1.6 /100 | #244 | Tragic 95.4% |
| Immigrants | Middle Africa | 1.5 /100 | #245 | Tragic 95.4% |
| Ethiopians | 1.5 /100 | #246 | Tragic 95.4% |
| Tongans | 1.3 /100 | #247 | Tragic 95.4% |
| Paiute | 1.2 /100 | #248 | Tragic 95.4% |
| Bolivians | 1.1 /100 | #249 | Tragic 95.4% |
| Immigrants | Cameroon | 0.9 /100 | #250 | Tragic 95.4% |
| Immigrants | Jamaica | 0.9 /100 | #251 | Tragic 95.4% |
| Immigrants | Ethiopia | 0.9 /100 | #252 | Tragic 95.3% |
| Somalis | 0.9 /100 | #253 | Tragic 95.3% |
| Colombians | 0.8 /100 | #254 | Tragic 95.3% |
| Koreans | 0.8 /100 | #255 | Tragic 95.3% |
| Immigrants | China | 0.7 /100 | #256 | Tragic 95.3% |