Immigrants from Sri Lanka vs Black/African American Median Female Earnings
COMPARE
Immigrants from Sri Lanka
Black/African American
Median Female Earnings
Median Female Earnings Comparison
Immigrants from Sri Lanka
Blacks/African Americans
$44,161
MEDIAN FEMALE EARNINGS
100.0/ 100
METRIC RATING
35th/ 347
METRIC RANK
$35,315
MEDIAN FEMALE EARNINGS
0.0/ 100
METRIC RATING
302nd/ 347
METRIC RANK
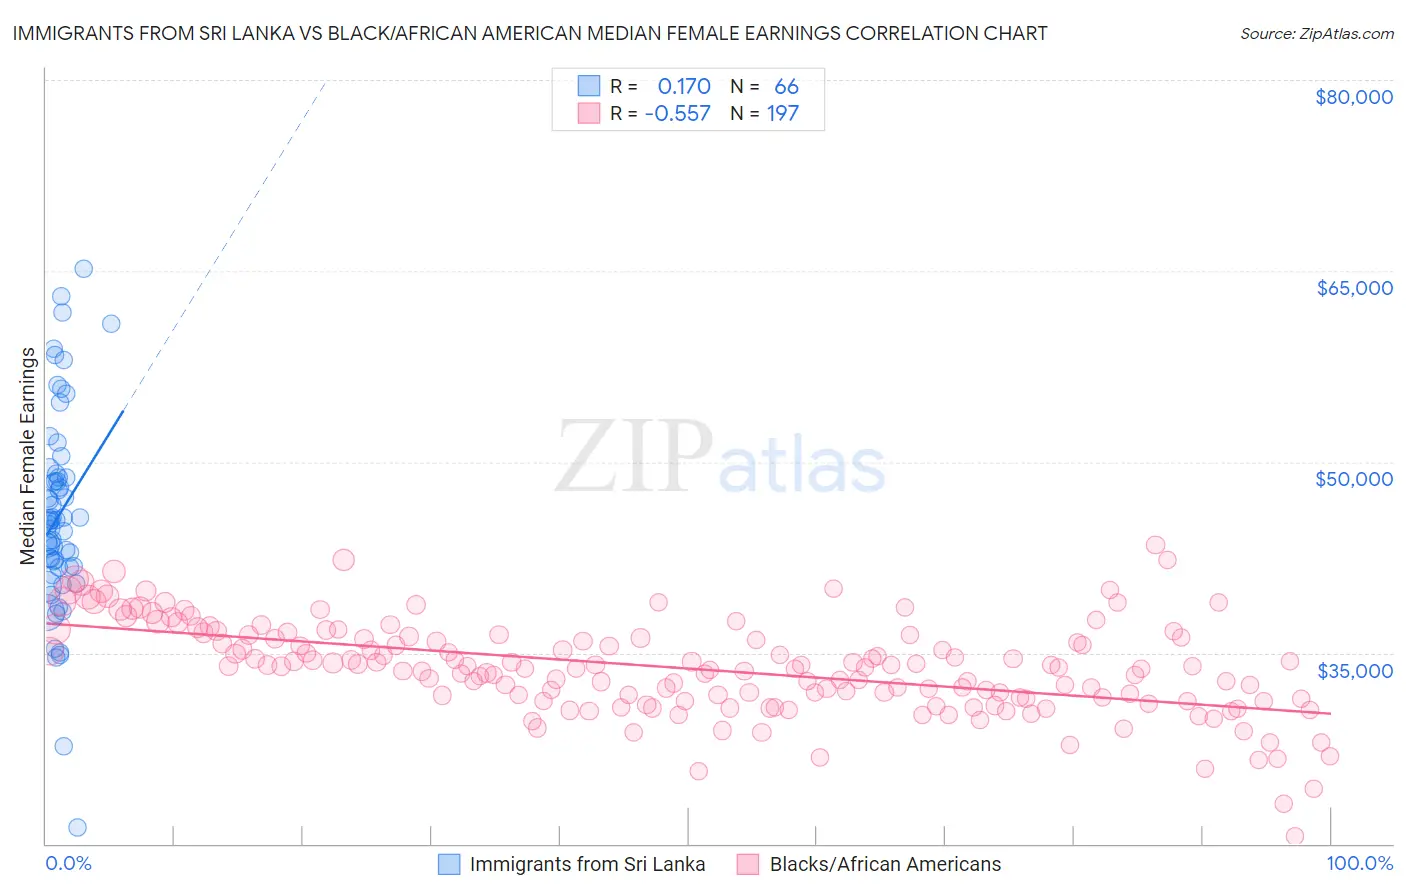
Immigrants from Sri Lanka vs Black/African American Median Female Earnings Correlation Chart
The statistical analysis conducted on geographies consisting of 149,683,911 people shows a poor positive correlation between the proportion of Immigrants from Sri Lanka and median female earnings in the United States with a correlation coefficient (R) of 0.170 and weighted average of $44,161. Similarly, the statistical analysis conducted on geographies consisting of 562,880,101 people shows a substantial negative correlation between the proportion of Blacks/African Americans and median female earnings in the United States with a correlation coefficient (R) of -0.557 and weighted average of $35,315, a difference of 25.1%.
Median Female Earnings Correlation Summary
| Measurement | Immigrants from Sri Lanka | Black/African American |
| Minimum | $21,250 | $20,616 |
| Maximum | $65,169 | $43,481 |
| Range | $43,919 | $22,865 |
| Mean | $45,787 | $33,784 |
| Median | $45,387 | $33,890 |
| Interquartile 25% (IQ1) | $41,731 | $31,353 |
| Interquartile 75% (IQ3) | $48,786 | $36,250 |
| Interquartile Range (IQR) | $7,055 | $4,897 |
| Standard Deviation (Sample) | $7,939 | $3,688 |
| Standard Deviation (Population) | $7,878 | $3,678 |
Similar Demographics by Median Female Earnings
Demographics Similar to Immigrants from Sri Lanka by Median Female Earnings
In terms of median female earnings, the demographic groups most similar to Immigrants from Sri Lanka are Russian ($44,169, a difference of 0.020%), Immigrants from Asia ($44,198, a difference of 0.080%), Immigrants from Turkey ($44,066, a difference of 0.21%), Immigrants from Switzerland ($43,996, a difference of 0.37%), and Immigrants from Northern Europe ($44,366, a difference of 0.46%).
| Demographics | Rating | Rank | Median Female Earnings |
| Immigrants | Russia | 100.0 /100 | #28 | Exceptional $44,680 |
| Immigrants | Belgium | 100.0 /100 | #29 | Exceptional $44,587 |
| Asians | 100.0 /100 | #30 | Exceptional $44,586 |
| Immigrants | France | 100.0 /100 | #31 | Exceptional $44,541 |
| Immigrants | Northern Europe | 100.0 /100 | #32 | Exceptional $44,366 |
| Immigrants | Asia | 100.0 /100 | #33 | Exceptional $44,198 |
| Russians | 100.0 /100 | #34 | Exceptional $44,169 |
| Immigrants | Sri Lanka | 100.0 /100 | #35 | Exceptional $44,161 |
| Immigrants | Turkey | 100.0 /100 | #36 | Exceptional $44,066 |
| Immigrants | Switzerland | 100.0 /100 | #37 | Exceptional $43,996 |
| Latvians | 100.0 /100 | #38 | Exceptional $43,941 |
| Israelis | 100.0 /100 | #39 | Exceptional $43,852 |
| Immigrants | Malaysia | 100.0 /100 | #40 | Exceptional $43,835 |
| Bhutanese | 100.0 /100 | #41 | Exceptional $43,648 |
| Immigrants | Denmark | 100.0 /100 | #42 | Exceptional $43,646 |
Demographics Similar to Blacks/African Americans by Median Female Earnings
In terms of median female earnings, the demographic groups most similar to Blacks/African Americans are Immigrants from Latin America ($35,307, a difference of 0.020%), Pima ($35,326, a difference of 0.030%), Crow ($35,266, a difference of 0.14%), Yuman ($35,377, a difference of 0.18%), and Immigrants from Guatemala ($35,444, a difference of 0.36%).
| Demographics | Rating | Rank | Median Female Earnings |
| Comanche | 0.0 /100 | #295 | Tragic $35,661 |
| Mexican American Indians | 0.0 /100 | #296 | Tragic $35,629 |
| Hmong | 0.0 /100 | #297 | Tragic $35,498 |
| Immigrants | Micronesia | 0.0 /100 | #298 | Tragic $35,477 |
| Immigrants | Guatemala | 0.0 /100 | #299 | Tragic $35,444 |
| Yuman | 0.0 /100 | #300 | Tragic $35,377 |
| Pima | 0.0 /100 | #301 | Tragic $35,326 |
| Blacks/African Americans | 0.0 /100 | #302 | Tragic $35,315 |
| Immigrants | Latin America | 0.0 /100 | #303 | Tragic $35,307 |
| Crow | 0.0 /100 | #304 | Tragic $35,266 |
| Bahamians | 0.0 /100 | #305 | Tragic $35,125 |
| Fijians | 0.0 /100 | #306 | Tragic $35,114 |
| Sioux | 0.0 /100 | #307 | Tragic $35,063 |
| Immigrants | Bahamas | 0.0 /100 | #308 | Tragic $35,027 |
| Hondurans | 0.0 /100 | #309 | Tragic $35,013 |